Students can Download 1st PUC Statistics Model Question Paper 4 with Answers, Karnataka 1st PUC Statistics Model Question Papers with Answers helps you to revise the complete Karnataka State Board Syllabus and score more marks in your examinations.
Karnataka 1st PUC Statistics Model Question Paper 4 with Answers
Time: 3 Hrs 15 Min
Max. Marks: 100
Note :
- Graph sheets and statistical tables will be supplied on request.
- Scientific calculators may be used.
- All working steps should be clearly shown.
Section-A
I. Answer any TEN of the following questions. (10 × 1 = 10)
Question 1.
State ‘Croxton and Cowdon’s’ definition of statistics.
Answer:
Statistics is a science of collection, presentation, analysis and interpolation of numerical data.
Question 2.
Who is an investigator?
Answer:
The person who conducts statistical investigation is a investigator.
Question 3.
What is tabulation of the data?
Answer:
Tabulation is the process of systematic arrangement of statistical data in vertical columns and horizontal rows, in the form of a table.
![]()
Question 4.
Write the formula of mid-points of a class.
Answer:

Question 5.
Which graph is used to locate a median?
Answer:
Ogives (less than Ogive) are used to locate the value of median.
Question 6.
What is class frequency?
Answer:
The number of observations corresponding to a particular class is known as the class frequency.
Question 7.
Find geometric mean of 2 and 8.
Answer:
We know that GM = \(\sqrt{a \times b}=\sqrt{2 \times 8}=\sqrt{16}\) = 4
Question 8.
For a data if D5 = 50, then what is the value of P50.
Answer:
Here D5 = 50, which divides into two equal parts. ∴ P50 also divides into two equal parts i.e. P5o = 50.
Question 9.
Mention the type of correlation between ‘speed of a vehicle and distance covered by it.
Answer:
It is a positive correlation.
Question 10.
What is interpolation?
Answer:
Interpolation is the technique of estimating the unknown value of dependent variable (y) for a given value of independant variable (x) which is within the limits or range of the independent variable.
Question 11.
If P(A) = \(\frac { 2 }{ 5 }\) , then find P(A’)
2 2 3
Answer:
Given P(A) = \(\frac { 2 }{ 5 }\), then P(A’) = 1 – P(A) = 1 – \(\frac { 2 }{ 5 }\) = \(\frac { 3 }{ 5 }\)
Question 12.
Define a random variable.
Answer:
Random variable is a function which assigns a real number-to every sample point in the sample space.
Section-B
II. Answer any TEN of the following questions. (10 × 2 = 20)
Question 13.
What is a continuous variable? Give an example.
Answer:
A random variable which assumes all the possible values in its range is a continuous random variable.
Ex: Height or weight of children.
Question 14.
Mention two methods of sampling.
Answer:
- Simple random sampling.
- Systematic sampling
- Stratified sampling.
Question 15.
What do you mean by inclusive class interval? Give an example.
Answer:
In a class if lower limit as well as upper limits are included in the same class, such a class is called inclusive class interval.
Ex.C.I. = (0 – 9), (10 – 19)…. (40 – 49).
![]()
Question 16.
What are stubs and captions of a table?
Answer:
Row headings are called stubs and column headings are called captions of a table.
Question 17.
Mention two objectives of diagrams and graphs.
Answer:
- They can be remembered for longer period of time.
- They facilitates comparison.
Question 18.
What is histogram?
Answer:
Histogram is a pictorial representation of graphs of frequency distribution by means of adjacent rectangles, whose areas are proportional to the frequencies represented.
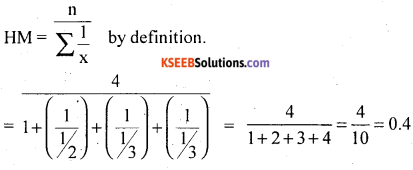
Question 19.
Find the harmonic mean of 1, \(\frac{1}{2}, \frac{1}{3}, \frac{1}{4}\)
Answer:
Question 20.
For a data, if median is 50 and mean deviation from median is 12, then find the coefficient.
Answer:

Question 21.
What are regression lines? Where they intersect?
Answer:
The graphs of regression equations are called regression lines.
They intersect at (x̄, ȳ)
![]()
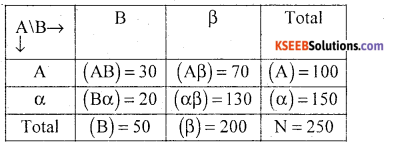
Question 22.
In case of two attributes, if N = 250, (AB) = 30, (A) = 100 and (B) = 50, then find the remaining classes and their frequencies.
Answer:
In a 2 × 2 contingency table of two attributes :
Question 23.
Two cards are drawn from a pack of 52 playing cards, what is the probability that they are king?
Answer:
![]()
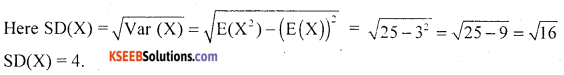
Question 24.
If E(X) = 3 and E(X2) = 25, then find SD (X).
Answer:
Section-C
III. Answer any EIGHT of the following questions. 8 × 5 = 40
Question 25.
Write the functions of statistics.
Answer:
The functions of statistics are :
- It simplifies complexity of the data.
- It reduces the bulk of the data.
- It adds precision to thinking.
- It helps in comparing different sets of figures.
- It guides in the formulation of policies and helps in planning. \
- It indicates trends and tendencies.
Question 26.
What are the guidelines for the construction of a questionnaire?
Answer:
The following points are considered while framing a schedule/questionnaire.
- Questions should be simple and easy to understand to get spontaneous answers.
- Questions should not confuse the reader and they should give one and only one meaning
- The number of questions should be kept minimum
- If possible the questions should be capable of getting a definite answers, with either yes or no, a number , a place or a date etc.,
- Questions should be capable of tabulating
- The questions should be such that the least intelligent and a educated can answer them with least trouble
- The questions should be arranged in logical order
- The questions which hurt the feelings of the informant and which are of personal and confidential nature should be avoided
- A far as possible the questions put should be corroborator at least on the point of importance 0 The questions should pre-tested in a small group of individuals before it is used
- Questionnaire should look attractive
- If possible a covering letter is attached along with the questionnaire.
![]()
Question 27.
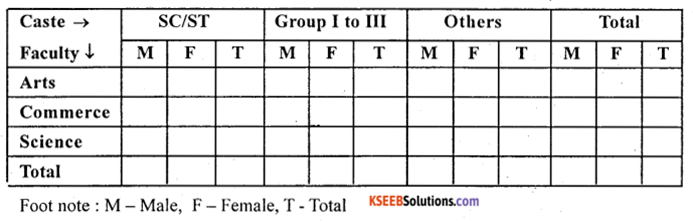
Prepare a blank table showing the particulars relating to the students of a college classified according to :
(a) Faculty : Arts, Commerce, Science.
(b) Caste : SC/ST, Group I to III, others
(c) Sex : Male and female
Answer:
Students strength of a college according to faculty, caste and sex.
Question 28.
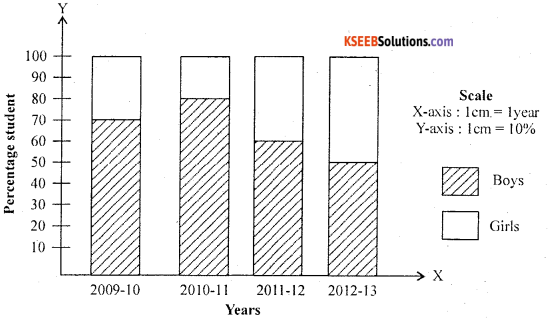
Following is the data regarding strength of a college. Draw percentage bar diagram for this data.
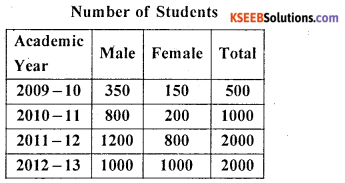
Answer:
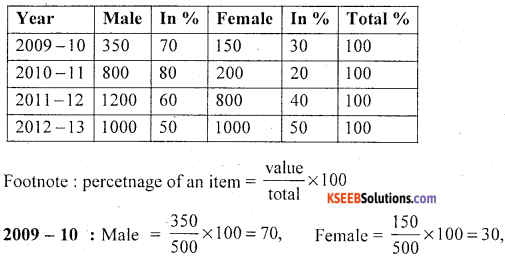
Similarly others can be calculated.
Percentage bar diagram shows the students strength of a college according to sex for the year 2009-10.
Question 29.
For the following observations, Find mean, median and mode : 12, 42, 25, 35, 67, 25, 56, 5, 75
Answer:
Arrange in ascending order : 5, 12, 25, 25, 35,42, 56, 67, 75
n = 9
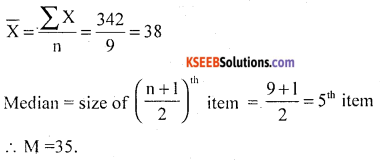
mode (z) = size of most repeated item = 25
![]()
Question 30.
Explain types of correlation with examples.
Answer:
The correlation may be
1. positive
2. negative
3. zero
1. Positive correlation : The two variables are said to be positively correlated if they vary • in the same direction.
Example
- Demand and supply
- Income and expenditure
2. Negative correlation : The two variables are said to be negatively correlated, if they vary in opposite direction.
Example
- Price and Demand/Sales
- Production and price of vegetables
3. Zero/non-correlation : The two variables does not show any related variation, they are said to be zero/non-correlated.
Example 1. Sales of pig iron and sale of pig iron.
Question 31.
Marks obtained by five students in two subjects are as follows : Find Spearman’s rank correlation coefficient for the data.
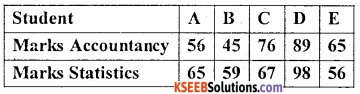
Answer:
Here the data is non-repeated so,
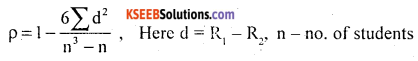
R1, R2 be the ranks in accountancy. (X) and Statistics (Y)
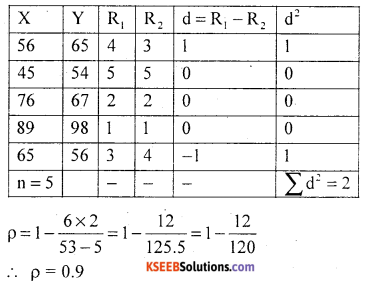
There exists a high degree positive correlation between marks in Accountancy and statistics
![]()
Question 32.
200 candidates appeared for II PUC examination in a college and 60 of them succeeded. 35 received a special coaching or tutorial class and out of them 20 candidates succeeded. Using Yule’s coefficient, discuss whether the special coaching is effective or not.
Answer:
Let A and B be ‘Attending coaching class’ and success in examination.
Let α not attending coaching class and β – failure in the examination.
then contingency table can be prepared as below.
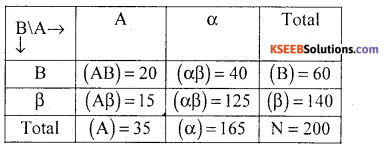
The Yule’s coefficient of association :
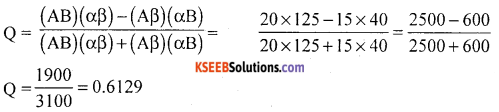
Conclusion : Here Q > 0.5, there exists a positive association i.e. special coaching is effective in success in examination.
Question 33.
Interpolate the index for 2008 from the following data.
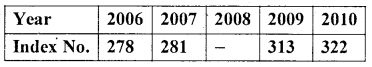
Answer:
Let X and Y be the year and index no.
From the data there are 4 known values of y are given,
so expand the Binomial (y -1)4 = 0
i.e. y4 – 4y3 + 6y2 – 4y1 + y0 =0
322 – 4 × 313 + 6y2 = 4 × 281 +278 = 0
322 – 1252 + 6y2 – 1124 + 278 = 0
600 – 2376 + 6y2 = 0
-1776 + 6y2 = 0
∴ y2 = \(\frac { 1776 }{ 6 }\) = 296
Question 34.
State and prove addition theorem of probability for two non-mutually exclusive events.
Answer:
Statement: Let A and B be two events with respective probabilities P(A) and P(B). Then the probability of occurrence of at least one of these two events is
P(A ∪B) = P(A) + P(B) – P(A ∩B)
Proof: A random experiment results ‘n’ exhaustive events m and m, events are favourable to events A and B respectively. And P out comes are common to A × B.
The probabilities are

Event (A ∪B) i.e. occurrence of at least one of the events is (m1, + m2 -D) favourable events.
![]()
P(A ∪B)= P(A) + P(B) – P(A ∩B): from result (1).
Hence the proof.
![]()
Question 35.
A bag contains 6 red balls and 4 white balls. What is the probability that two balls drawn are
(i) of the same colour
(ii) of different colours.
Answer:
(i) P (2 balls drawn are of same colour) = P(2 red balls) OR P(2 white balls)

(ii) P(drawing different coloured balls) = 1 – P(drawing 2 same coloured balls)
= 1 – \(\frac { 21 }{ 45 }\) = 1 – 0.47 = 0.53
∵ P(A’) = 1 – P(A)
Question 36.
If X is a random variable and ‘a’ is any constant, then prove that E(ax) = aE(X) and var(ax) = a2var(x)
Answer:
Proof : (i) E(ax) = Σax(px)
By definition E(X) = ΣxP(X) = aΣxP(X)
∴ E(ax) = aE(x)
(ii) var(ax) = E[ax – aE(x)]2
by definition of var (x) = E [x – E(x)]2 = E [ax – aE(x)]2 = a2E [x – E(x)]2
var(ax)=a2 var(x)
Section-D
IV. Answer any TWO of the following questions. (2 × 10 = 20)
Question 37.
Which series is better? and which is more consistent?

Answer:
Betterness will be decided on the basis of means of X and Y.
Consistency will be decided on the basis of C.V’s. (coefficient variations)
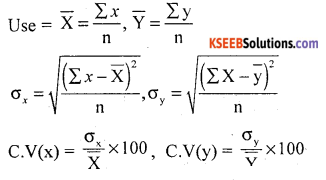
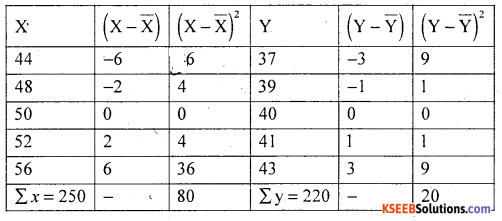
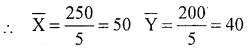
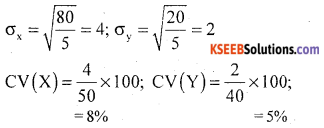
Here X̄ > Ȳ ; X series is better and
CV(Y) < (V(X); Y series is more consistent.
![]()
Question 38.
Find Karl Pearson’s coefficient of skewness for the following data.
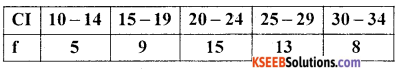
Answer:
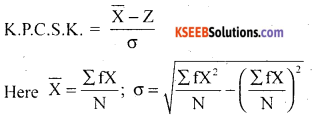
X = Midpoints or C.l.
Modal class = size of highest frequency
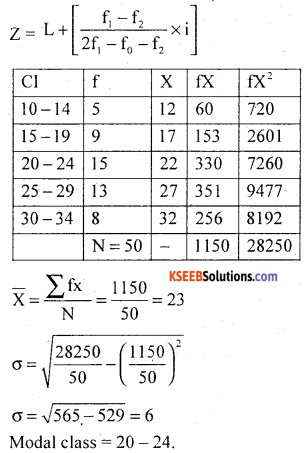
After converting into exclusive CI = 19.5 – 24.5
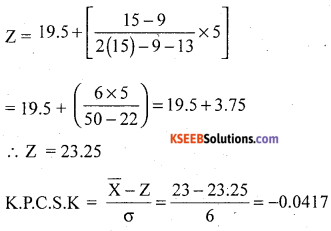
The distribution is negatively skewed
Question 39.
For the following bivariate data, find Karl Pearson’s coefficient of correlation
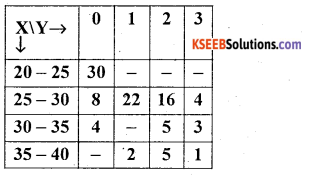
Answer:
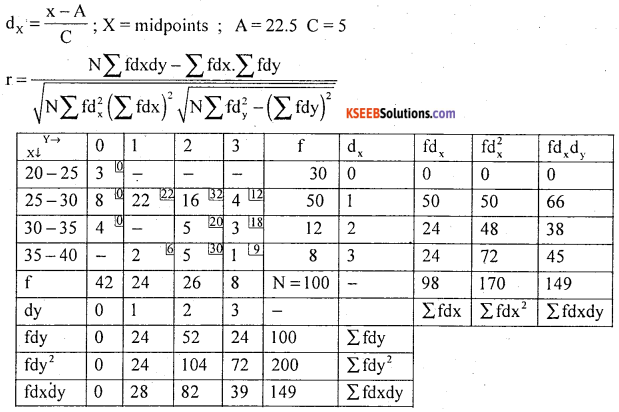
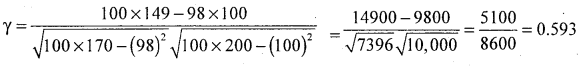
There exists a high degree positive correlation between x and y.
![]()
Section-E
IV. Answer any TWO of the following questions. (2 × 5=10)
Question 40.
(a) The probability that a boy will pass an examination is \(\frac { 3 }{ 5 }\) and that of a girl is \(\frac { 2 }{ 5 }\). Find the probability that
(i) both of them passes the examination
(ii) at least one of them passes the examination.
Answer:
(i) P(Boy and Girl passes examination)
= P(B ∩G) = P(B).P(G) = \(\frac { 3 }{ 5 }\) × \(\frac { 2 }{ 5 }\) = \(\frac { 6 }{ 25 }\)
(ii)
P (at lest one of them passes the examination)
= P(A ∪B) = P(A) + P(B) – P(A ∩B)
P(B ∪G) = P(B) + P(G) – P(B ∩G)
\(=\frac{3}{5}+\frac{2}{5}-\frac{6}{25}=\frac{3 \times 5+2 \times 5-6}{25}=\frac{19}{25}=0.76\)
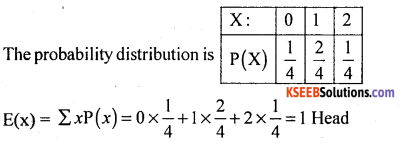
Question 40.
(b) Find the mathematical expectations of number of beads obtained when two fair coins are tossed.
Answer:
Let’X denote the number of heads obtained which take the values of X : 0 (No heads), 1 (one head) and 2 (2 heads) with respective probabilities \(\frac { 1 }{ 4 }\), \(\frac { 2 }{ 4 }\), \(\frac { 1 }{ 4 }\) .
Question 41.
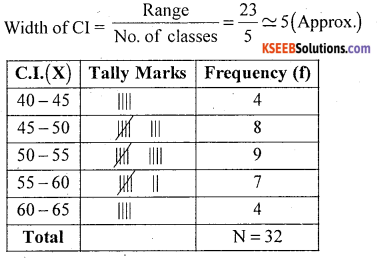
Following are the weights in (kgs) of 40 students of a college. Prepare a continuous frequency distribution table with suitable class interval.
Weight in (kgs) :
45 56 50 41 55 51 46 50 45 57 64 48 53 43 63 45 57 44 54 59 49 52 42 61 51 63 48 56 45 50 55 50
Answer:
Highest value = 64, Lowest value = 41
Range = HV – LV = 64 – 41 = 23
![]()
Question 42.
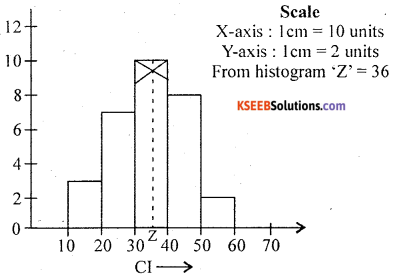
Draw a histogram. Hence find the value of mode(Z) through the graph.
Answer:
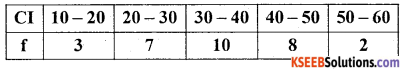
Question 43.
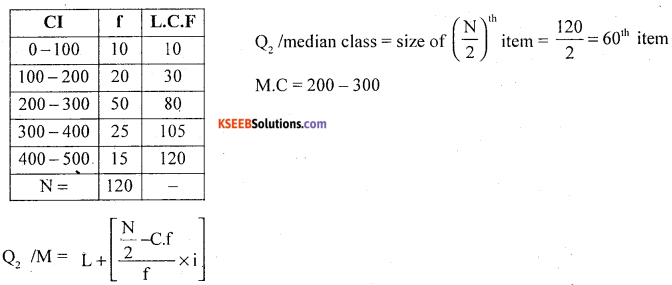
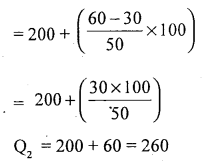
For the following data find the second Quartile. (Q2).
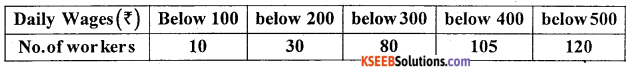
Answer:
Convert the less than cumulative frequency distribution in to simple (i.e. upper limits and L.C.F.are given)
![]()
Question 44.
There are 10 tickets in a bag which are numbered 1, 2, 3…10. Two tickets are drawn randomly one after the other with replacement. Find the expectation of the sum of the numbers drawn.
Answer:
Let X and Y be the numbers on the first and second tickets drawn.
Then the numbers on the 1st ticket drawn is a discrete random variable which takes the values : X – 1, 2, 3 …….. 10 with each probability \(\frac { 1 }{ 10 }\) each.
To
E(X) = ΣX.P(X)
= 1 × \(\frac { 1 }{ 10 }\) + 2 × \(\frac { 1 }{ 10 }\) + 3 × \(\frac { 1 }{ 10 }\) + …. +10 × \(\frac { 1 }{ 10 }\)
= \(\frac { 1 }{ 10 }\) [1 + 2 + 3 + 4 + 5 + 6 + 7 + 8 + 9 + 10] = \(\frac { 55 }{ 10 }\) = 5.5 10L J 10
Since X and Y are independent takes same values with respective probabilities.
∴ E(X + Y) = E(X).E(Y) = 5.5 + 5.5 = 11