Students can Download 1st PUC Economics Previous Year Question Paper March 2020 (South), Karnataka 1st PUC Economics Model Question Papers with Answers helps you to revise the complete Karnataka State Board Syllabus and score more marks in your examinations.
Karnataka 1st PUC Economics Previous Year Question Paper March 2020 (South)
Time: 3.15 Hours
Max Marks: 100
Instructions:
- Write the question numbers legibly in the margin.
- Answer for a question should be continuous.
Section – A
I. Choose the correct answer: ( 1 × 5 = 5 )
Question 1.
Alternative uses of resources give rise in the problem of
(a) Rights
(b) Price
(c) Choice
(d) Chance
Answer:
(c) Choice
Question 2.
What is the graphical measure available to measure dispersion.
(a) Lorenz curve
(b) Marshal curve
(c) Production curve
(d) Non of the above
Answer:
(a) Lorenz curve
Question 3.
In India census is carried out once in
(a) 5 years
(b) 10 years
(c) 1 year
(d) 2 years
(b) 10 years
Question 4.
It is an agricultural allied activity
(a) Poultry
(b) Cottage industry
(c) Small industry
(d) Tourism
Answer:
(a) Poultry
![]()
Question 5.
Urban people are mainly engaged in the
(a) Primary sector
(b) Service sector
(c) Mining
(d) Agriculture
Answer:
(b) Service sector
II. Fill in the blanks: ( 1 × 5 = 5 )
Question 6.
Frequency distribution of discrete frequency is called ________________
Answer:
Frequency array
Question 7.
Arithmetic line graph is also called __________
Answer:
Time Series Graph
Question 8.
There are ___________ Quartiles in a series.
Answer:
3
Question 9.
Infrastructure facilities can be classified into types.
Answer:
Two
Question 10.
The great leap forward campaign was initiated in the year
Answer:
1958
![]()
III. Match the following: ( 1 × 5 = 5 )
Question 11.
| A | B |
| 1. Personal Interview | 1. The monetary’ assistance given by government for production activities |
| 2. W.P.I | 2. Sustainable development |
| 3. Subsidies | 3. More expensive |
| 4. Educational achievement | 4. Whole sale price index |
| 5. Bio pest control | 5. Literacy rate |
Answer:
1 -3;
2 -4;
3-1;
4-5;
5-2.
IV. Answer the following questions in a word sentence: ( 1 × 5 = 5 )
Question 12.
Mention the last step in developing project.
Answer:
The last step in developing a project is to draw meaningful conclusions after analyzing and interpreting the results.
Question 13.
ILO – Expand.
Answer:
International Labour Organisation.
Question 14.
What is the liberalization?
Answer:
Liberalization refers to the removal restrictions and opening up various sectors of the economy by giving freedom to invest.
Question 15.
Give the meaning of poverty.
Answer:
Povert is a state of living where people are unable to get the basic necessities of life.
Question 16.
Give the meaning of infant mortality rate?
Answer:
Infant mortality rate is the death of babies per thousand live births.
Section – B
V. Answer any four of the following questions in four sentence each. ( 2 × 4 = 8 )
Question 17.
Mention any two modes of collecting data.
Answer:
The two modes of collecting data are personal interview and mailing questionnaires.
Question 18.
How can you obtain a frequency curve?
Answer:
The frequency curve is obtained by drawing a smooth freehand curve passing through the points of the frequency polygon as closely as possible. It may not necessarily pass through all the points of the frequency polygon but it passes through them as closely as possible.
![]()
Question 19.
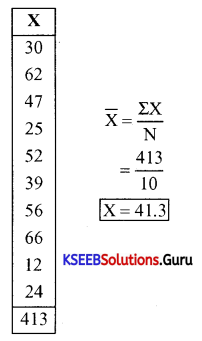
Calculate the arithmetic mean from the following data.
Marks obtained by 10 students
![]()
Answer:
Question 20.
Mention the types of Correlation.
Answer:
There are two types of correlation negative correlation and positive correlation. Again they are classified perfect positive and perfect negative correlations.
Question 21.
Mention the types of variable.
Answer:
There are two types of variables namely. Continuous variable and discrete variable.
![]()
Question 22.
Mention the name of any four statistical tools
Answer:
The most important statistical tools arc the measures of central tendency, dispersion, correlation. bar diagrams, pie chart, histogram. etc.
VI. Answer any five of the following questions in four sentence each. ( 2 × 5 = 10 )
Question 23.
What were the infrastructure facilities developed during colonial rule?
Answer:
The main infrastructure facilities developed during colonial rule were railways. ports. water transport. posts and telegraphs. However, the real motive behind this development was not to provide basic amenities to the people but to subserve various colonial interests.
Question 24.
What do you mean by carrying capacity of environment?
Answer:
Carrying capacity implies that the resource extraction is not above the rate of regeneration of the resource and the wastes generated are within the assimilating capacity of the environment.
Question 25.
Who are the Urban poor? Give example.
Answer:
Urban poor are those who live in cities and towns without basic needs. Example: push cart. vendors. Street cobblers. women who string flowers, rag pickers. vendors and beggars.
Question 26.
What are the various forms of health expenditure?
Answer:
The various forms of health expenditures as follows:
- Preventive medicine (vaccination)
- Curative medicine (medical intervention during illness)
- Social medicine (spread of health awareness)
- Provision of clean drinking water and good sanitation.
Question 27.
Mention the two benefits of organic farming.
Answer:
The main benefits of organic farming arc as follows:
- It offers a means to substitute costlier agricultural inputs (chemical fertilizers, pesticides) with cheaper ones
- it generates income through exports
- It contributes to ecological balance
- Provides healthy and chemical-free food.
![]()
Question 28.
Name the three sectors of the economy.
Answer:
The three sectors of the economy are as follows:
- Primary sector: It includes agriculture. mining, fishing, forestry, etc.
- Secondary sector: It includes all manufacturing industries.
- Service sector: It includes, transport. communication, banking. insurance, health. education. warehousing. etc.
Question 29.
Which are the economic infrastructures?
Answer:
The economic infrastructural facilities arc those which directly contribute towards economic development The main economic infrastructures are energy, transportation, communication. banking. insurance, warehouse. etc.
Section – C
VII. Answer any three of the following questions in twelve sentence each. ( 3 × 4 = 12 )
Question 30.
Briefly explain how statistics helps to study economics.
Answer:
Statistics plays a very important role in the field ofeconomics It helps in the study of economics in many ways:
(a) It helps to understand economiC problems: B using various statistical tools, effort is being made to find the causes behind the economic problems with the help of qualitative and the quantitative facts. Once the causes of a problem arc identified. it is easier to formulate certain policies to tackle them.
(b) It enables an economist to present economic facts in a precise and definite form: Statistics help the economists to present economic facts with accuracy. It also helps in proper comprehension of what is stated in the subject matter. When economic facts are expressed in statistical terms. they become exact. Exact facts are more convincing than vague statements. For instance. saving 350 people have died in Kashmir unrest since 2000, is more accurate than saving that a lot of people have died in the unrest.
(e) Helps in condensing mass data into a few numerical measures: Statistics condenses the mass data into a few numerical measures like mean, variance, correlation, etc. These numerical measures help to summarise data. For example. it would be impossible to remember the income of all the people ofa country. But we can remember average income i.e., per capita income.
(d) It is used to find relationships between different economic factors: An economist may be interested in finding out what happens to the demand for a commodity when its price changes or what will be impact on inflation, when the government has more budget deficits. Such situations can be dealt, if any relationship exists between the various economic factors. Here, the nature of relationship can be studied with the help of statistical tools.
(e) It helps in formulation of plans and policies: Sometimes, formulating plans and policies require the knowledge of future trends. For instance, an economic planner has to decide in 2010 how much the economy should produce in 2016-17. In otherwords, one must know what could be the expected level of consumption in 2016-17. So. the statistical tools to predict consumption in 20 16-17 could be based on the data of consumption of past years obtained by surveys.
![]()
Question 31.
Briefly explain sampling errors.
Answer:
Sampling error refers to the differences between the sample estimate and the actual value of a characteristic of the population. Ills the error that occurs when you make an observation from the samples taken from the population.
Thus, the difference between the actual value of a parameter of the population and its estimate is the sampling error. It is possible to reduce the magnitude of sampling error by taking a larger sample.
For example. suppose the height of 5 students (in inches) are 50. 55. 60. 65. 70. the average height will be calculated by adding all these observations and dividing the sum by 5 then get 60 inches. If we select a sample of two students with height of 50 and 60 inches. then average height of sample will be 50 + 60 divided by 2. we get 55 inches. Here the sampling error of the estimate will be 60 (true value) minus 55 (estimate) 5.
Question 32.
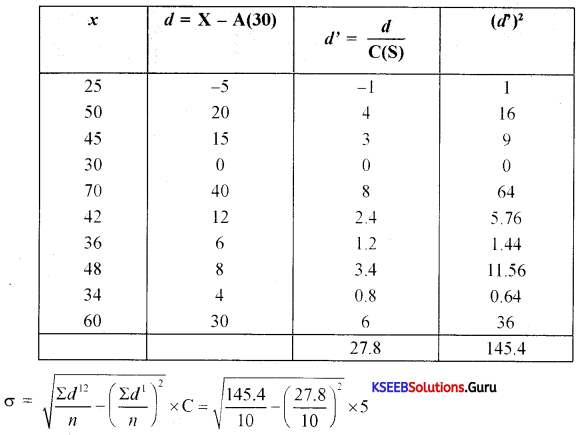
Find the standard deviation for the following data.
![]()
Answer:
Question 33.
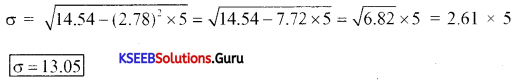
Draw scatter diagram

Intcrprctation: There is a perfect positive correlation between X and Y.
(For Blind students)
Mention the properties of correlation.
Answer:
The following are the major properties of correlation coefficient:
- Correlation ‘r’ has no unit. it is a pure number. It meaiis units of measurement are not part of r.
- A negative value of r indicates an inverse relation. A change in one variable is associated with change in the other variable in the opposite direction. For instance, when price of tomato increases, its demand decreases.
- If ‘r’ is positive the two variables move in the same direction. When the price of coffee rises, a substitute of tea. the demand for tea increases.
- The value of the correlation coefficient lies between minus one and plus one. (-1 ≤ r ≤ 1).
- If r = O, the two variables are uncorrelated. There is no linear relation between them.
- However, other types of relations may be there.
- If r =1 or r = —1. the correlation is perfect. The relation between them is exact,
- A low value of r indicates a weak linear relation. Its value is said to be low when it is close to zero.
- The magnitude of r is unaffected by the change of origin and change of scale.
![]()
Question 34.
Differentiate between Continuous and discrete variables.
Answer:
|
Continuous Variable |
Discrete Variable |
| It can take any numerical value. | It can take only certain values. |
| It may take integral values, fractional values and values that are not exact fractions. | Its value changes only by finite ‘jumps’. It ‘jumps’ from one value to another, but does not take any intermediate value. |
| For example, the height of a student, as he grows say from 100 to 150 cm. would take all the values in between 100 and 150. | For example, a variable like the ‘number of girls in a class’, for different classes, would assume values that are only whole numbers. It cannot take any fractional value like 0.5 because ‘half of a student’ is absurd. |
| The variable is capable of manifesting in every conceivable value and its values can also be broken down into infinite gradations. | It takes a value change from 100 to 101. 102 etc, but fractions are not taken it i.e., there cannot be 100.1, 100.5 etc. |
| Other examples of a continuous variable are weight, time, distance, etc. | Other examples for a discrete variable are population, number of cars, buses and number appearing on a dice. |
VIII. Answer any four of the following questions in twelve sentence each: ( 4 × 4 = 16 )
Question 35.
The traditional handicraft industries were ruined under British Rule. Justify this statement.
Answer:
Yes. the traditional handicrafts industries were ruined under British rule. The decline of the indigenous handicraft industries created not only massive unemployment in India but also a new demand in the Indian consumer market, which was now deprived of the supply of locally made goods.
The British imposed heavy duties on Indian handicrafts, so that the became more expensive than British woolen and silk manufacturers. Thc followed a policy of dut free export of raw materials and import of finished goods. Apart from these, Indian handicrafts had to face competition from machine made goods from Britain.
India could not develop a sound industrial base under the colonial rule. Even as the country ‘s world famous handicraft industries declined, no corresponding modem industrial base was allowed to come tip to take pride of place so long enjoyed by the Indians. The intention of British was to reduce India to the status of a mere exporter of important raw materials for the upcoming modem industries in Britain and to turn India into a market for their finished products of those industries, so that their continued expansion could be ensured to the maximum advantage of their home country.
Question 36.
Explain any two of the objectives of five year planning.
Answer:
The main goals of the five year plans are Growth, modernization, self-reliance and equity. They can be illustrated as follows:
(a) Growth: It refers to the increase in the gross domestic product. It also implies that the increase in the country’s capacity to produce the output of goods and services within the country, It includes larger stock of productive capital or a larger size of supporting services like transport and banking or an increase in the efficiency of productive capital land services.
A good indicator of economic growth, in the language of economics, is a steady increase in the gross domestic product (GDP). The GDP is the market value of all the goods and services produced in the country during a year. The GDP of a country is derived from the different sectors of the economy, namely agricultural sector, the industrial sector and the service sector.
(b) Modernization: Adoption of new technology is called as modernization. To increase the production of goods and services producers have to adopt new technologies. For example, a farmer can increase the output on his farm by using new seed varieties instead of using the old ones. Similarly, a factory can increase output by using a new types of machineries.
Modernisation does not refer only to the use of new technology but also to changes in social outlook such as the recognition that women should have the same rights as men. In a traditional society, women are supposed to remain at home while men work.
(c) Self-reliance: The first seven five year plans gave importance to self-reliance Self-reliance refers to avoiding imports of those goods which could be produced in India itself. This policy was considered a necessity in order to reduce our dependence on foreign countries, especially for food. It is a well-known fact that, people who were recently freed from foreign domination should give importance to self-reliance.
(d) Equity: Growth with equity is one of the objectives of planning. A country can have high economic growth, the most modern technology developed within the country itself but still have most of its people living in poverty. it is important to ensure that the benefits of economic prosperity reach the poorer sections as well instead of being enjoyed only by the rich. So. in addition to growth. modernization and self-reliance, equity is also important. Every Indian should be able to meet his or her basic needs such as food, a decent house, education and health care and so inequality in the distribution of wealth should be reduced.
![]()
Question 37.
Briefly explain the financial sector reforms.
Answer:
The financial sector consists of financial institutions like commercial banks, investment banks, stock exchange operations and foreign exchange market.
The financial sector in India is regulated by the Reserve Bank of India. The RBI decides the amount of money that the banks can keep with themselves, fixes interest rates, nature of lending to various sectors, etc.
The major objective of financial sector reforms is to reduce the role of RBI from regulator to facilitator of financial sector. That means, the financial sector may be allowed to take decisions on many matters independent of RBI.
The financial sector reform policies led to the establishment of private sector banks both Indian and foreign. Foreign investment limit in banks was raised to around 50%. The banks which fulfil certain conditions have been given freedom to set up new branches without the approval of the RBI. Foreign institutional investors (FII) like merchant bankers. mutual funds and pension funds arc now allowed to invest in Indian financial markets.
Question 38.
Explain the employment generator programming of poverty alleviation in India.
Answer:
The income and employment generation approach was started during the third five-year plan. It is based on specific poverty alleviation and employment generation aspects.
(a) Self-employment programmes: The major self-employment programmes are:
Swarnajayanti Grani Swarozgar Yojana (SGSY): This programme aims at providing financial assistance to self-help groups which then decide whom the loan is to be given to for self-employment activities among the members.
- Swarnajayanthi Shahari Rozgar Yojana (SJSRY): ¡t aims at creating employment opportunities for both self-employment and wage employment opportunities in urban areas. Under self-employment programmes. financial assistance was given to families or individuals, Now, programmes are encouraged to form self help groups.
- Pradhana Manthri Rozgar Yojana (PNIRY): The educated unemployed from Low-income families in rural and urban areas can get financial help to set up any kind of enterprise that generates employment, under this scheme.
(b) Wage employment programmes: The major national programmes to generate wage employment arc as follows:
- National Food for Work Programme (NFWP)
- Sampooma Gramccna RozgarYojana ( SGRY).
- Mahatma Gandhi National Rural Employment Guarantee Programme (MGNREGP): it provides guaranteed wage employment to every household whose one adult volunteer will get unskilled labour for a minimum of 100 days ¡n a year,
Question 39.
Explain the defects of the agricultural market.
Answer:
Agricultural marketing is a process that involves assembling, storage, processing, transportation. packaging, grading and distr4bution of different agricultural commodities across the country. The major drawbacks of agriculture marketing in India arc as follows:
- long chain of middlemen taking away the profit of farmers
- No proper storage facilities to protect the agricultural products
- Faulty methods of weighing/measuring agricultural crops
- Manipulation of accounts
- Farmers are forced to sell their products at low prices due to lack of information.
![]()
Question 40.
What are the various indicators of the human development index?
Answer:
The various indicators of human development are as follows:
(a) Human development index: It consists of standard of living index, life expectancy at birth and educational attainment. If the HDI is high it is good indicator of human development.
(b) Life expectancy at birth: It is the average number of years a person is expected to live. In other words, it is the longevity of life. A high value of life expectancy better indicates a quality human development.
(c) Adult literacy rate: It is the average number of persons who have reading and writing skills with basic local knowledge. It is expressed in percentages. The high literacy rate shows high human development.
(d) GDP per capita: The gross domestic product per head is also one of the indicators of human development. The high value of GDP per capita indicates better human development.
(e) Infant mortality rate: It means the death of babies per thousand live births. If the IMR . is high it indicator’s low human development.
(f) Maternal mortality rate: It shows the death of mothers per 1 lakh live births. If MMR is low, it indicates better human development.
(g) Population using improved sanitation: If the percentage of the population using improved sanitation is more, it is a good indicator of human development.
(h) Population with sustainable access to improved water sources: If the percentage of the population using sustainable access to an improved water source is high, it is a good indicator of human development.
(i) People living below the poverty line: If fewer people are living below the poverty line, then it is a good indicator of human development.
(j) Percentage of children undernourished: If the number of undernourished children is diminishing, then it is a good indicator of human development
Section – D
IX. Answer any two of the following questions in about twenty sentence each. ( 2 × 6 = 12 )
Question 41.
What are the parts of a Table? Explain.
Answer:
When data is represented in rows and columns, it is called tabulation. To construct a table, it is important to know the different components of a good statistical table. When all the components are put together systematically, they form a table.
Tabulation can be done using one way. two way or three-way classification depending upon the number of characteristics involved.
A good table should have the following parts:
(a) Table number: Table number is given to a table for identification purposes. If more than one table is presented, it is the table number that distinguishes one table from another. It is given at the top or at the beginning of the title of the table.
(b) Title: The title of the table gives about the contents of the table. It has to be very clear, brief and carefully worded, so information interpretations made from the table are clear and free from any confusion.
(c) Captions: These are the column headings given as designations to explain the figures of the column.
(d) Stubs: These are headings given to row s of the table. The designations of the row-s are also called stubs or stub items and the left column is known as stub column.
(e) Body of the table: It is the main part and it contains the actual data. Location of any one data in the table is fixed and determined by the row and column of the table.
(f) Headnote/Unit of measurement: The units of measurement of the figures in the table should always be stated along w ith the title. If figures are large, they should be rounded off and the method of rounding should be indicated.
Question 42.
Calculate co-efficient of Quartile deviation for the following distribution.

Answer:
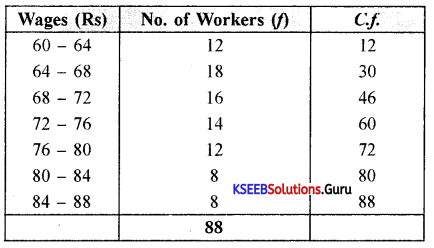
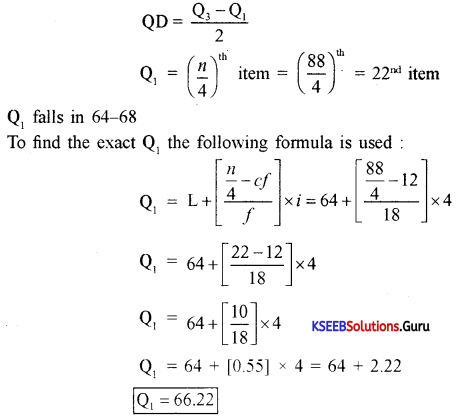
Now to calculate Q1
Q3 = Size of \(\left(\frac{3(n)}{4}\right)^{t h}\) item = Size of \(\frac{3(88)^{t h}}{4}\) item
= Size of \(\left(\frac{264}{4}\right)^{\text {th }}\) item = Size of 66th item
So the Q3 falls in 76 – 80
To calculate the exact Q3 the following formula is used:
Coefficient of QD = 0.08 161
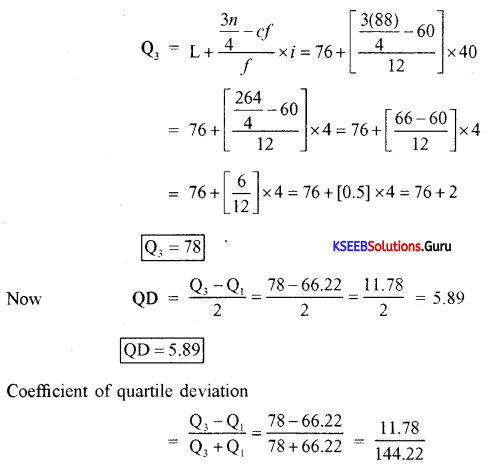
Question 43.
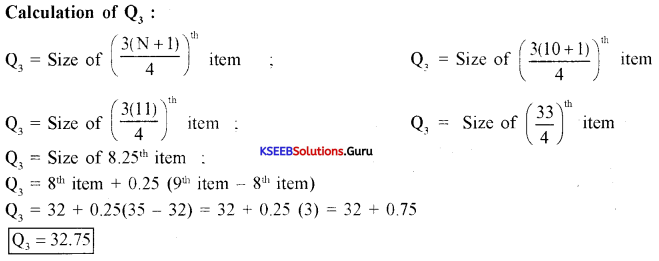
Calculate Q1, Q2 and Q3 from the following data.
22, 26, 14, 30, 18, 11, 35, 41, 12, 32
Answer:

X. Answer any two of the following questions in about twenty sentence each. ( 2 × 6 = 12 )
Question 44.
Explain the effects of Reforms in Agriculture.
Answer:
The economic reforms of 1991 have not been able to benefit agriculture, where the growth rate is not up to the expected level.
The public scctor investment in agricultural sector. particularly in infrastructural development like irrigation. power. roads, market linkages and research and extension has fallen during in the reform period.
The removal of fertilizer subsidy has lcd to an increase in the cost of production, which has severely affected the small and marginal farmers.
This sector has been experiencing a number of policy changes such as reduction in import duties on agricultural products, removal of minimum support price and lifting of quantitative restrictions on agricultural products.
These have adversely affected Indian farmers as they now have to face increased international competition.
Further, due to export oriented polic strategies in agriculture, there has been a shift from production for the domestic market towards production for the export market focusing on cash crops in steel of production of food grains. This has resulted in increase in an prices of food grains.
![]()
Question 45.
Examine the role of education in the Economic Development of a nation.
Answer:
The education plays a predominant role in economic development of India in the following ways:
(a) It modernizes the attitude and behaviour of the people: Education brings favourable changes in the attitude and behaviour of people. It gives inputs like what is right and what is wrong and contributes for taking sound and valuable judgments.
(b) Promotes science and technology: Education always provides the knowledge about latest technology to people who know reading and writing. It explains the new methods of production through innovations in various sectors of the economy. By providing scope for latest techniques of production, it develops agriculture, industry, transport, power, etc.
(c) Increases mobility of labours: Education helps the labourers to search for more reward¬ing employment opportunities all over the w7orld. It helps to chooses a suitable career according to one’s educational qualifications. It makes them to move from country to country or state to state as and when required.
(d) Creates national and developmental consciousness: Education creates civic, national and developmental consciousness among the literates. It provides information about the past events in History and tells about the freedom struggle of great national leaders like Mahatma Gandhi, Bhagath Singh, Subhas Chandra Bose and others. It makes people to develop a sense of patriotism and helps them to adopt strategies of progress in life.
(e) Contributes to skilled and trained workers: Education generates skilled and trained labour force needed for the development of the country. Education includes both general and technical education. The general education includes Bachelor of Arts. Bachelor of Commerce, Bachelor in Business Administration, etc. at the degree level and technical education includes Bachelor in Engineering in different streams like mechanical, civil, electronic, electrical, computer, etc. All these contribute for the supply of skilled labour for tlie overall development of the country.
(f) Act as source of knowledge: Education is a house of know ledge for all purposes. Any¬thing to know we need to be literate. It helps people to take decisions on the basis of their know ledge gained in different stages while getting education .
(g) Develops moral values: As education provides number of stories and incidents people’s lives, people can definitely develop moral values. These moral values are included in their daily life. Some of the moral values arer not to sell adulterated products, in case of seller and in case of buyer, not to create inconvenience for others in their routine life and so on.
(h) Creates awareness about culture and politics: Education always provides complete information about cultural heritage of any nation. It explains how they are constructed with the investment of money and human capital. It helps them to preserve historical monuments, inscriptions and other valuable items. It also provides day-to-day information about politics when the person is literate.
Question 46.
What role does the government p!av in generating employment opportunities in India?
Answer:
Government is making efforts to generate employment opportunities to unemployed persons through two categories i.e., direct and indirect.
In the first category, government is directly providing job opportunities by employing people in various departments for administrative purposes, industries, hotels, transport corporations etc.
In the second category, Government had introduced a New Economic Policy in 1991 in the form of LPG i.e., Liberalization, Priviatisation and Globalisation which has provided ampl ; opportunities to private entrepreneurs to start their own production centre which are creating employment opportunities to millions of people in India.
Further, when output of goods and services from government enterprises increase, then private enterprises which receive raw materials from government enterprises will also raise their output and hence increase the number of employment opportunities in the economy. For instance, when a government owned steel company increases its output, it will result in direct increase in employment in that government company, simultaneously, private companies, which purchase steel from it will also increase their output and thus employment. This is indirect generation of employment opportunities by the government initiatives in the economy.
There are many programmes that the successive governments have implemented to alleviate poverty through employment generation. They are known as Employment Generation Programmes.
They are as follows:
Self-employment programmes: The major Self Employment Programmes are:
- Swarna Jayanti Gram Swarozgar Yojana (SGSY): This programme aims at providing financial assistance to self help groups which then decide whom the loan is to be given to for self-employment activities among the members.
- Swarnajayanthi Shahari Rozgar Yojana (SJSRY): It aims at creating employment opportunities, for both self-employment and wage employment opportunities in urban areas. Under self-employment programmes, financial assistance is given to families or individuals. Now, programmes are encouraged to form self-help groups.
- Pradhana Manthri Rozgar Yojana (PMRY): The educated unemployed from low-income families in rural and urban areas can get financial help to set up some enterprise that generates employment under this scheme.
Wage employment programmes: The major national programmes to generate wage employment are as follows:
- National Food for Work Programme (NFWP)
- Sampoorna Grameena Rozgar Yojana (SGRY)
- Mahatma Gandhi National Rural Employment Guarantee Programme (MGNREGP): It provides guaranteed wage employment to every household whose one adult volunteer will get unskilled labour for a minimum of 100 days in a year.
All these programmes aim at providing not only employment but also services in areas such as primary health, primary education, rural drinking water, nutrition, assistance for people to buy income and employment generating assets, development of community assets by generating wage employment, assistance for constructing houses, laying of rural roads, development of wastelands.
XI. Answer any two of the following project oriented questions. ( 2 × 5 = 10 )
Question 47.
Prepare a list of causes of land Degradation in India.
Answer:
Land in India suffers from varying degrees and types of degradation. These are increasing mainly due to the factors mentioned below:
(a) Deforestation. i.e. reckless cutting down of trees resulting in loss of vegetation.
(b) Indiscriminate and over exploitation of forest products such as fuel wood and overgrazing.
(c) Conversion of forest lands into agricultural lands.
(d) Forest fire and faulty methods of cultivation.
(e) Excessive application of pesticides and insecticides.
(f) Disproportionate and excessive use of chemical fertilizers in Indian agriculture.
(g) The irrigation systems in India are not properly planned and managed.
(h) Overexploitation of ground water for various competing utilities like human settlement, industrialization, etc.
(j) No proper introduction of crop rotation techniques and organic fanning.
(j) Illiteracy and ignorance of rural population in respect of causes and effects of land degradation.
Land is indispensable for human settlement. 1f proper care is not taken for the conservation of land and water, there shall be severe scarcity of water and natural resources in future which may lead to conflict among the countries.
![]()
Question 48.
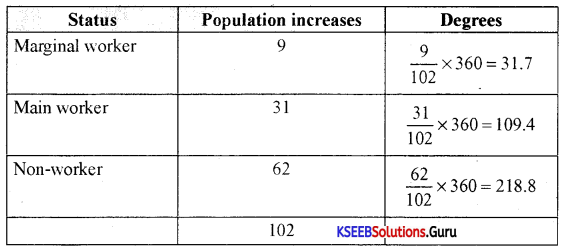
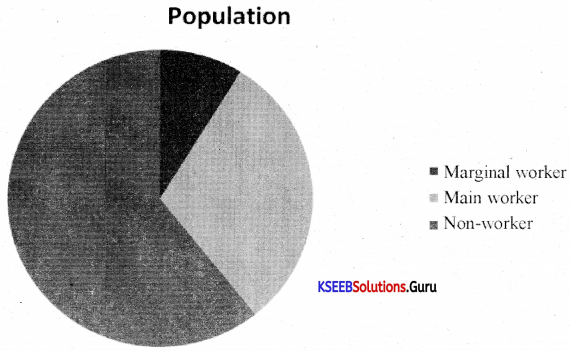
On the basis of data you have collected regarding the participation of women in your locality in the below mentioned categories construct a Pie Chart.
|
Status |
Population |
| (a) Marginal Worker | 12 |
| (b) Main Worker | 36 |
| (c) Non-Worker | 73 |
Answer:
Question 49.
Write a note on SENSEX.
| Status | Population |
| (a) Marginal Worker | 12 |
| (b) Main Worker | 36 |
| (c) Non-Worker | 73 |
Answer:
Sensex is the short form for the of Bombay Stock Exchange Sensitive Index with 1978-79 as base. The value of the sensex is with reference to this period. It is the benchmark index for the
Indian stock market, It consists of3O stocks which represent 13 sectors of the economy and the companies listed are leaders in their respective industries. If the sensex rises. ¡t indicates that the market is doing well and investors expect better earnings from companies. It also indicates a growing confidence of investors in the basic health of the economy.
Further, the sensitive index is a market capitalization of the weighted index of a sample of large. well established and financially sound companies. It is the oldest index in India and has acquired a unique place in the collcctie consciousness of investors. This index is idely used to measure the performance of the Indian stock market. It is the pulse of the Indian capital market.