Students can Download 1st PUC Economics Previous Year Question Paper March 2020 (North), Karnataka 1st PUC Economics Model Question Papers with Answers helps you to revise the complete Karnataka State Board Syllabus and score more marks in your examinations.
Karnataka 1st PUC Economics Previous Year Question Paper March 2020 (North)
Time: 3.15 Hours
Max Marks: 100
Instructions:
- Write the question numbers legibly in the margin.
- Answer for a question should be continuous.
Section – A
I. Choose the correct answer: ( 1 × 5 = 5 )
Question 1.
Alternative uses of resources give rise to the problem of
(a) Rights
(b) Price
(c) Choice
(d) Chance
Answer:
(c) Choice
Question 2.
Range is the
(a) Difference between the largest and the smallest values of a variable
(b) Average of the largest and smallest observation.
(c) Ratio of the largest and smallest values of a variable.
(d) None of the above
Answer:
(a) Difference between the largest and the smallest values of a variable
Question 3.
During British rule more than half of India’s foreign trade was restricted to
(a) Britain
(b) Iran
(c) China
(d) Srilanka
Answer:
(a) Britain
Question 4.
The act provides guaranteed wage employment to every poor household for a minimum of 100 days a year is called.
(a) PMRY
(b) SJSRY
(c) MGNREGA
(d) SGSY
Answer:
(c) MGNREGA
![]()
Question 5.
Urban people are mainly engaged in the
(a) primary sector
(b) service sector
(c) mining
(d) agriculture
Answer:
(b) service sector
II. Fill in the blanks: ( 1 × 5 = 5 )
Question 6.
_________ of the table contains actual data.
Answer:
Body
Question 7.
Using current year quantities as weights is known as
Answer:
Paasche Price Index.
Question 8.
Taxes on incomes of individuals is called ______
Answer:
Direct tax
Question 9.
Infrastructure facilities can be classified into __________ types.
Answer:
Two
Question 10.
Forests are _________ resource.
Answer:
Natural.
III. Match the following: ( 1 × 5 = 5 )
Question 11.
|
A |
B |
| 1. Pilot survey | (a) India and the knowledge economy |
| 2. Median | (b) Institutional source |
| 3. Subsidy | (c) Pretesting of questionnaire |
| 4. World Bank | (d) The monetary assistance for production activities |
| 5. NABARD | (e) Positional value |
Answer:
1 – c
2 – e
3 – d
4 – a
5 – b
![]()
IV. Answer the following questions in a word sentence: ( 1 × 5 = 5 )
Question 12.
What is mean deviation?
Answer:
Mean deviation is the arithmetic nican of the differences of the values from their average. The average used is either arithmetic mean or median.
Question 13.
Mention the last step in developing a project.
Answer:
The last step in developing a project is to draw meaningful conclusions after analyzing and interpreting the results.
Question 14.
Give the meaning of infant mortality rate.
Answer:
Infant mortality rate is the death of babies per thousand live births.
Question 15.
Expand ILO.
Answer:
International Labour Organisation.
![]()
Question 16.
Name the campaign initiated in China with the aim of industrialisation.
Answer:
The Great Leap Forward campaign was initiated in ¡958 with the aim of industrialization.
Section – B
V. Answer any four of the following questions in four sentence each. ( 2 × 4 = 8 )
Question 17.
Mention the two sources of data.
Answer:
Primary data and scconda data are the two sources of data.
Question 18.
Give the formula to find out mid-point.
Answer:
The formula to find out midpoint is as folIos:
Mid point = \(\frac{\text { Upper class limit }+\text { Lower class limit }}{2}\)
Question 19.
What kind of diagrams are more effective in presenting the following?
(a) Monthly rainfall in a year
(b) Composition of the population of Delhi by religion,
Answer:
(a) For the monthly rainfall in a year. simple bar graph can be used to represent in diagram.
(b) For the composition of population of Delhi by religion, component bar diagram or pie chart can be used to represent the data.
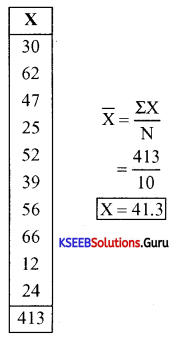
Question 20.
Calculate arithmetic mean from the following data.
Marks obtained by 10 students.
30, 62, 47, 25, 52, 39, 56, 66,12, 24
Answer:
Question 21.
What is negative correlation? Give an example.
Answer:
The correlation is said to be negative in the variables move in opposite directions.
Example:
- When the price of tomato increases, the demand for tomatoes decreases.
- More is the time spent for studies, less arc the chances of failure,
![]()
Question 22.
Mention the name of any four statistical tools.
Answer:
The most important statistical tools are the measures of central tendency, dispersion, correlation. bar diagrams. pie chart. histogram. etc.
VI. Answer any five of the following questions in four sentence each. ( 2 × 5 = 10 )
Question 23.
List out the important export goods of India before independence.
Answer:
The important export goods of India before independence were raw silk, cotton, wool, sugar. indigo, jute. etc.
Question 24.
List the factors that prevent the successful implementation of poverty alleviation programmes.
Answer:
The cm ment scholars, while assessing the poverty alleviations programmes, state these major areas of concern that prevent their successful implementation.
They are as follows:
(a) The benefits from direct poverty alleviation programmes have been appropriated by the non-poor
(b) The amount of resources allocated for poverty alleviation programmes is not sufficient
(c) These properties depend mainly on government and bank officials for their implementation. These are ill-motivated, inadequately trained, corruption prone and vulnerable
(d) The resources are inefficiently used and wasted
(e) There is also non-participation of local level institutions in programme implementation.
Question 25.
What are the two major sources of human capital in a country?
Answer:
Education and Health are two main sources of human capital. Education mises the standard and quality of living of people. It increases the production capacity and productivity of the workforce b enhancing their skills. Health indirectly helps in the economic development by supplying active energetic and healthy workforce for better production.
Question 26.
Give two examples of alternative market.
Answer:
The examples for the alternative market are:
- Rvthara Santhe in Karnataka.
- Rvthu Bazaar in Andhra Pradesh (Vegetable and Fruit markets)
- Apni Mandi in Punjab. Harvana and Rajasthan.
![]()
Question 27.
Name any four kinds of unemployment,
Answer:
The kinds of unemployment are as follows:
- Open unemployment
- Disguised unemployment
- Seasonal unemployment
- Underemployment
- Technical unemployment
- Frictional unemployment.
Question 28.
Which are the components of Indian system of medicine?
Answer:
The components of Indian systems of medicine (AYUSH) are as follos:
- Avurveda.
- Yoga
- Unani
- Siddha
- Naturopath
- Homeopathy.
Question 29.
Mention any four functions of the environment.
Answer:
The major functions of environment are as follows:
(a) The environment supplies both renewable and non-renewable resources. Renewable resources are those resources that can be used again and again. There will be a continuous supply of resources. Example. water. forest, land, etc.
Non-renewable resources arc those which get exhausted with extraction and use. Example, mineral resources like petrol, coal, iron ore, etc.
(b) The Environment assimilates waste. That means that environment absorbs the solid and liquid wastes created by humans and other living beings.
(c) The environment sustains the life on earth by providing both genetic and bio-diversities.
(d) Environment also provides aesthetic services like beautiful scenery of forest land, water falls, mountains like the Himalaya ranges, lagoons, glaciers, valleys, etc.
Section – C
VII. Answer any three of the following questions in twelve sentence each. ( 3 × 4 = 12 )
Question 30.
Briefly explain how statistics helps to study economics.
Answer:
Statistics play s a very important role in the field of economics It helps in the study of economics in many ways:
(a) It helps to understand economic problems: By using various statistical tools, effort is being made to find the causes behind the economic problems with the help of qualitative and the quantitative facts. Once the causes of a problem are identified. it is easier to formulate certain policies to tackle them.
(b) It enables an economist to present economic facts in a precise and definite form: Statistics help the economists to present economic facts with accuracy. It also helps in proper comprehension of what is stated in the subject matter. When economic facts are expressed in statistical terms, they become exact. Exact facts are more convincing than vague statements. For instance. saving 350 people have died in Kashmir unrest since 2000, is more accurate than saving that a lot of people have died in the unrest.
(e) Helps in condensing mass data into a few numerical measures: Statistics condenses the mass data into a few numerical measures like mean, variance, correlation, etc. These numerical measures help to summarise data. For example, it would be impossible to remember the income of all the people of a country, But we can remember average income i.e. per capita income.
(d) It is used to find relationships between different economic factors: An economist may be interested in finding out what happens to the demand for a commodity when its price changes or what will be impact on inflation when the government has more budget deficits. Such situations can be dealt, if any relationship exists bctwecn the various economic factors. Here, the nature of relationship can be studied with the help of statistical tools.
(e) It helps in formulation of plans and policies: Sometimes, formulating plans and policies require the knowledge of future trends. For instance, an economic planner has to decide in 2010 how much the economy should produce in 2016-17. In otherwords, one must know what could be the expected level of consumption in 2016-17, So. the statistical tools to predict consumption in 20 16-17 could be based on the data of consumption of past years obtained by surveys.
![]()
Question 31.
Write briefly about the Census and NSSO.
Answer:
Census : The census of India provides the most complete and continuous demographic record of population. The census is being regularly conducted every ten years since 1881. The first census after independence was conducted in 1951. It is also called as the method of complete Enumeration. The essential feature of this method is that it covers every individual unit in the entire population. In this method a house-to-house enquiry is carried out, covering all households in India. Demographic data on birth and death rates, literacy, employment, life expectancy, size and composition of population etc. are collected and published by the Register General of India.
The census officials collect information on various aspects of population such as the size, density, sex ratio, literacy, migration, rural urban distribution, etc. Census data is interpreted and analysed to understand many economic and social issues in India.
NSSO : There are some agencies both at the national and state level to collect, process and tabulate the statistical data. One of such agencies is NSSO i.e., National Sample Survey Organisation.
The NSSO was established by the Government of India to conduct nation-wide surveys on socio-economic issues. The NSSO does continuous surveys in successive rounds. The data collected by NSSO are released through reports and its quarterly journal Sarvekshana. NSSO provides periodic estimates of literacy, school enrolment, utilization of educational services, employment unemployment, manufacturing and service sector enterprises, morbidity, child care, utilization of the public distribution system, etc.
The NSSO also collects details of industrial activities and retail prices for various goods. They are used by Government of India for planning purposes.
Question 32.
Write a note on classification of data.
Answer:
The raw data is classified in various ways depending on the purpose. Generally data can be classified as follows:
(a) Chronological classification: When the data is grouped according to time, it is called as chronological classification. In SLICh a classification, data are classified either in ascending or in descending order ith reference to time such as years. quarters. months weeks days. etc.
(b) Spatial classification: 1f the data arc classified with reference to geographical locations such as countries. states. cities, districts. etc.. it is called spatial classification.
(c) Qualitative classification: When the data arc classified on the basis of certain attributes or qualities like literacy, religion, gender. marital status etc.. then it is called qualitative classification. These attributes can be classified on the basis of either the presence or the absence of a quantitative characteristic.
(d) Quantitative classification: If the classification of data is done on the basis of certain characteristics like height. weight. age. income, marks of students etc., it is called as quantitative classification,
![]()
Question 33.
The yield of rice per acre for 10 districts of a state, are as under:
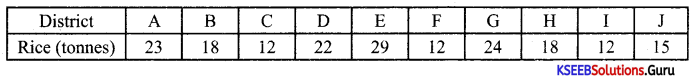
Calculate mean deviation from median.
Answer:
Values in ascending order
X: 12 12 12 15 18 18 22 23 29 34
Median = Size of \(\left(\frac{N+1}{2}\right)^{t h}\) item
Median = Size of \(\left(\frac{10+1}{2}\right)^{t h}\) item
= Size of \(\left(\frac{11}{2}\right)^{\text {th }}\) item
= 5.5th item
To get median. we need to add 5th and 6th items and divide it by 2.
Question 34.
Draw scatter diagram and interpret.

Answer:
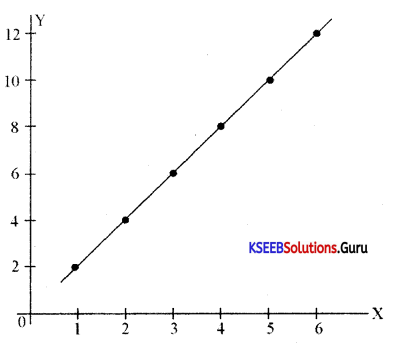
Interpretation: There is a perfect positive correlation between X and Y.
VIII. Answer any four of the following questions in twelve sentence each: ( 4 × 4 = 16 )
Question 35.
Indicate the volume and direction of trade at the time of independence.
Answer:
The volume of foreign trade includes the quantities of goods and scrvices which were being exported and imported The direction of trade refers to the countries which were involved during British rule. The volume and direction of India’s foreign trade at the time of independence is as follows:
During the regime of colonial government, India became an exporter of primary goods like raw silk, cotton. wool, sugar, raw jute etc., and an importer of finished consumer goods like cotton, silk and woolen clothes and capital goods like light machineries produced by the factories at Britain.
Britain had maintained monopoly over India’s exports and imports. As a result, more than half of India’s foreign trade was restricted to Britain. while the rest was allowed with a few other countries like China. Srilanka, Iran, etc. The opening of the Suez Canal further intensified British control over India ‘s foreign trade.
Question 36.
Write a short note on Green revolution.
Answer:
Green revolution refers to the spectacular increase in the agricultural production during 1960s. There was a large scale production of food grains resulting from the Lise of high ieldrng variety seeds especiall wheat and rice. The USC of these seeds required the use of fertilizer and pesticides in correct quantities as well as regular supply of water. The application of these inputs in correct proportions is very vital.
The farmers to could benefit from HYV seeds required reliable irrigation facilities as well as the financìal support to purchase chemical fertilizers and pesticides. As a result, in the first phase of the green revolution during the 1960s and 1970s. the use of HYV seeds as restricted to the more affluent states such as Pun jab. Andhra Pradesh and Taniil Nadu, Further, the use of high yielding variety seeds primarily benefitted the wheat-growing regions only, During the mid-1970s to mid-1980s. the llYVtechnologv spread to a larger number of states and benefited more variety of crops. The spread of green revolution technology enabled India to achieve self-sufficiency in food grains: vc no longer had to be at the mercy of America. or any other country for meeting our nation’s food requirements.
Question 37.
Briefly explain the background of economic reforms in India.
Answer:
There was a financial crisis that persisted since 1980. We know that to introduce various policies, the government has to generate funds from various sources like taxation, running public sector enterprises etc. When the expenditure is more than the income, the government takes loans to balance the deficit from banks and also from people within the country and from international banks,
The various development policies require huge finance. But there was a scarcity of funds. Even though the revenues were very low, the government had to overshoot its revenue to meet the challenges like unemployment, poverty and population explosion. The continued spending on development programmes of the government did not generate additional revenue. At the same time, the government could not generate funds internally. When the government wàs spending a large share of its income on areas which do not provide immediate returns, there was a need to use the rest of its revenue in a highly efficient manner, The income from public sector undertakings was also not very high to meet the growing expenditure.
Further, the foreign exchange. borrowed from other countries and international banks was spent on meeting consumption needs. No sincere efforts were made to reduce expenditure and to increase our exports.
During late 1980’s government expenditure exceeded its income. Prices of many essential goods increased. Imports grew at a very large extent. Foreign exchange reserves declined considerably and the same fall short to finance our imports for more than two weeks. There was shortage of funds even to pay interest to international lenders and at the same time no country or international bank was ready to lend any more to India.
At this situation. India approached the International Bank for Reconstruction and Development and International Monetary Fund and received seven billion dollars as loan to manage the crisis. To avail loans, these international banks expected India to liberalise and open up its economy by removing restrictions on the priate sector, reduce the role of government in man areas and remove trade restrictions between India and other countries.
India had to agree to these conditions of IBRD and IMF and announced the new economic policy which included liberalization, privatization and globalization.
Question 38.
Explain the drawbacks of agricultural market in India.
Answer:
Agricultural marketing is a process that involves the assembling, storage, processing, transportation. packaging, grading and dístnbution of different agricultural commodities across the country. The major drawbacks of agriculture marketing in India are as follows:
- Long chain of middlemen taking away the profit of farmers
- No proper storage facilities to protect the agricultural products
- Faulty methods of weighing/encasing agricultural crops
- Manipulation of accounts
- Farmers are forced to sell their products at low prices due to lack of information.
![]()
Question 39.
Write a note on private health infrastructure in India.
Answer:
Nowadavs private sector has been playing a dominant role in medical education and training. medical technology and diagnostics. manufacture and sale of phannaceuticals. hospital construction and the provision of medical services.
- More than 70% of the hospitals in India are run by the private sector
- The private sector controls nearly two-fifth of beds available in hospitals
- Nearly 60% of dispensaries are run by the private sector
- The private sector provides healthcare for 80% of outpatients and 46% of in-patients
- Due to liberalization policy of Government of India. many non-resident Indians and industnal and pharmaceutical companies have set up state-of-art super-specialty hospitals to attract India’s rich and medical tourists.
Question 40.
What are the various indicators of human development?
Answer:
The various indicators of human development are as follows:
(a) Human development index: It consists of standard of living index, life expectancy at birth and educational attainment. Ifthc HDI is high it is good indicator of human development.
(b) Life expectancy at birth: It is the average number of years a person is expected to live. In other words, it is the longevity of life A high value of life expectancy better indicates a quality human development.
(c) Adult literacy rate: It is the average number of persons who have reading and writing skills with basic local knowledge. It is expressed in percentags, The high literacy rate shows high human development.
(d) GDP per capita: The gross domestic product per head is also one of the indicators ofhurnan development. The high value of GDP per capita indicates better human development.
(e) Infant mortality rate: It means the death of babies per thousand live births. If the IMR is high it indicter’s low human development.
(f) Maternal mortality rate: It shows the death of mothers per I lakh live births. If MMR is low, it indicates a better human development.
(g) Population using improved sanitation: ¡f the percentage of population using improved sanitation is more, it is a good indicator of human development.
(h) Population with sustainable access to improved water sources: 1f the percentage of population using sustainable access to improved water source is high, it is a good indicator of human development.
(i) People living below poverty line: ¡f less people are living belo poertv line, then it is a good indicator of human development.
(j) Percentage of children undernounshed: If the number of undernourished children is diminishing, then it is a good indicator of human development.
Section – D
IX. Answer any two of the following questions in about twenty sentence each. ( 2 × 6 = 12 )
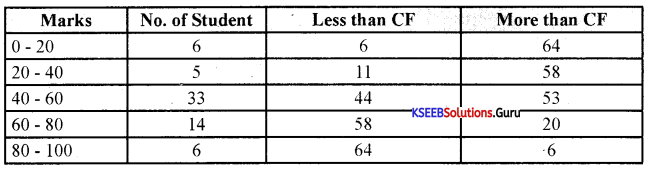
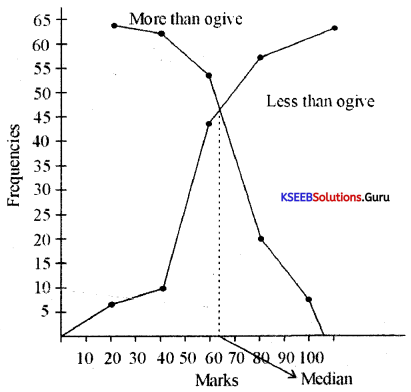
Question 41.
Construct Ogive by using the following data.
|
Marks (X) |
Number of students (f) |
| 0-20 | 6 |
| 20-40 | 5 |
| 40-60 | 33 |
| 60-80 | 14 |
| 80-100 | 6 |
| Total | 64 |
Answer:
Ogie is also called cumulative frequency curve. As there arc two types of cumulative frequencies. for example less than’ type and morc than type. accordingly thcrc are two ogives for any grouped frequency distribution data. Here in place of simple frequencies as in the case of frequency polygon, cumulative frequencies are plotted along Y axis against class limits of the frequency distribution. For less than ogives the cumulative frequencies arc plotted against the respective upper limits of the class intervals whereas for more than ogives the cumulative frequencies arc plotted against the respective lower limits of the class interval.
An interesting characteristic of the two ogives together is that their intersection point gives tIc median of the frequency distribution. The following graph represents the ogives. As the shapi.s of the two ogives suggest. less than’ ogive is never decreasing and ‘more than’ ogive is never increasing.
Question 42.
Find the median of the following data.

Answer:
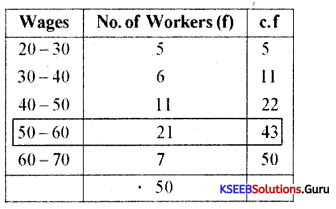
Median = Size of \(\left(\frac{N}{2}\right)^{t h}\) item = Size of \(\left(\frac{50}{2}\right)^{\text {th }}\) item
= Size of 25th item ie., 50 – 60
To calculate the exact median the following formula is used:
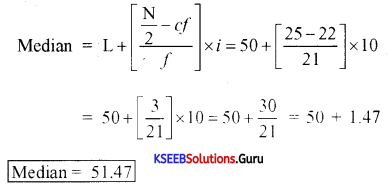
Question 43.
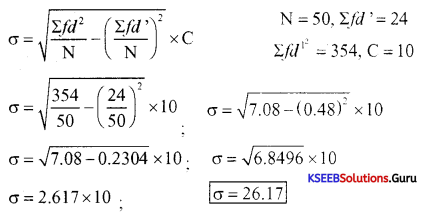
Calculate the standard deviation for the following distribution.
| Classes |
Frequencies |
| 0-20 | 9 |
| 20-40 | 12 |
| 40-60 | 20 |
| 60-80 | 14 |
| 80-100 | 3 |
| 50 |
Answer:
X. Answer any two of the following questions in about twenty sentence each. ( 2 × 6 = 12 )
Question 44.
Briefly explain the important area of liberalisation.
Answer:
Liberalisation was one of the reforms of New Economic Policy of 1991. It was introduced to put an end to the restrictions and open up various sectors of the economy. The following are the important areas of liberalization:
(a) Deregulation of industrial sector: The liberalization policy removed many restrictions enforced on industrial sector. Industrial licensing was abolished for almost all but product categories like alcohol, cigarettes, hazardous chemicals, industrial explosives, electronics, aerospace and drugs and pharmaceuticals. The only industries which are not reserved for the public sector are defence equipments, atomic energy generation and railway transport. Many goods produced by the small scale industries have now been dereserved.
(b) Financial sector reforms: The financial sector consists of financial institutions like commercial banks, investment banks, stock exchange operations and foreign exchange market.
The financial sector in India is regulated by the Reserv e Bank of India. The RBI decides the amount of money that the banks can keep with themselves, fixes interest rates, nature of lending to various sectors, etc.
The major objective of financial sector reforms is to reduce the role of RBI from regulator to facilitator of financial sector. That means, the financial sector may be allow ed to take decisions on many matters independent of RBI.
The financial sector reform policies led to the establishment of private sector banks both Indian and foreign. Foreign investment limit in banks was raised to around 50%. The banks which fulfil certain conditions have been given freedom to set up new branches without the approval of the RBI. Foreign institutional investors (FII) like merchant bankers, mutual funds and pension funds are now allowed to invest in Indian financial markets.
(c) Tax reforms: These are the reforms which are concerned with government’s taxation and public expenditure policies which are collectively known as its fiscal policy. There are two types of taxes, direct and indirect.
Since 1991, there has been a continuous reduction in the taxes on individual incomes as it was felt that high rates of income tax were an important reason for tax evasion. It is now widely accepted that moderate rates of income tax encourage savings and voluntary disclosure of income
The rate of corporation tax (tax on income of companies) which was very high earlier has been gradually reduced. A new tax called Goods and Services Tax (GST) has been introduced from 1.7.2017 to bring uniformity in indirect taxes.
In order to encourage better compliance on the part of tax payers, many procedures have been simplified and the rates also substantially lowered.
(d) Foreign exchange reforms: During 1991, the Government took an immediate measure to resolve the balance of payments crisis, the rupee was devalued against foreign currencies. This led to an increase in the inflow of foreign exchange. It also set the tone to free the determination of rupee value in the foreign exchange market from government control. At present, the market forces i.e., demand and supply, determine the exchange rates.
(e) Trade and investment policy reforms: A new trade and investment policy under liberalization strategy was made to increase international competitiveness of industrial production and a foreign investments and technology into the economy. The aim was also to promote the efficiency of the local industries and the adoption of modem technologies.
To protect Indian industries, the government was following quantitative restrictions on imports which encouraged tight control over imports. At the same time, tariffs were very high. These policies reduced efficiency and competitiveness which led to a slower growth of manufacturing sector.
The main objectives of Trade and Investment Policy were:
- To remove quantitative restrictions on imports
- To reduce quantitative restrictions in exports
- Reducing tariff rates
- Removal of licensing system.
Import licensing was abolished except in case of hazardous and environmentally sensitive industries. Quantitative restrictions on imports of manufactured consumer goods and agricultural products were also fully removed.
Export duties have been removed to increase the competitive position of Indian goods in the international markets.
A process of disinvestment was also initiated by selling of part of equity shares of public sector enterprises to the public.
![]()
Question 45.
Discuss the following as a source of human capital formation.
1. Health infrastructure
2. Expenditure on migration.
Answer:
(a) Health infrastructure: The various forms of health expenditures are as follows:
- Preventive medicine vaccinations to prevent deadly diseases
- Curative medicine obtaining medical treatment during illness
- Social medicine spread of awareness about keeping good health and its importance.
- Provision of clean drinking water and good sanitation.
Healths individuals are a food source of human capital as they directly contribute for regular and higher productivity of labor. A sick laborer without access to medical facilities has to remain absent from work. This leads to loss of productivity. Hence, expenditure on health is an important source of human capital formation.
(b) Expenditure on migration: People migrate from their native places in search ofjobs which may bring higher salaries, Unemployment is the only reason for rural-urban migration in India. Technically qualified persons like engineers and doctors migrate to other countries to earn better income Though there is a high cost of transport, high cost of living and other factors, the enhanced income will motivate people to migrate. Hence. expenditure on migration is also a source of human capital formation.
Question 46.
What role does the government play in generation of employment opportunities in India.
Answer:
Government is making efforts to generate employment opportunities to unemployed persons through two categories i.e., direct and indirect.
In the first category, government is directly providing job opportunities by employing people in various departments for administrative purposes, industries, hotels, transport corporations etc.
In the second category, the Government had introduced a New Economic Policy in 1991 in the form of LPG i.e., Liberalization, Privatisation and Globalisation which has provided ampl ; opportunities to private entrepreneurs to start their own production centre which are creating employment opportunities to millions of people in India.
Further, when output of goods and services from government enterprises increase, then private enterprises which receive raw materials from government enterprises will also raise their output and hence increase the number of employment opportunities in the economy. For instance, when a government owned steel company increases its output, it will result in direct increase in employment in that government company, simultaneously, private companies, which purchase steel from it will also increase their output and thus employment. This is indirect generation of employment opportunities by the government initiatives in the economy.
There are many programmes that the successive governments have implemented to alleviate poverty through employment generation. They are known as Employment Generation Programmes. They are as follows:
Self-employment programmes: The major Self Employment Programmes are:
- Swarnajayanti Gram Swarozgar Yojana (SGSY): This program aims at providing financial assistance to self help groups which then decide whom the loan is to be given to for self-employment activities among the members.
- Swarnajayanthi Shahari Rozgar Yojana (SJSRY): It aims at creating employment opportunities, for both self-employment and wage employment opportunities in urban areas. Under self-employment programmes, financial assistance is given to families or individuals. Now, programs are encouraged to form self help groups.
- Pradhana Manthri Rozgar Yojana (PMRY): The educated unemployed from low-income families in rural and urban areas can get financial help to set up some enterprise that generates employment under this scheme.
Wage employment programmes: The major national programmes to generate w’age employment are as follows:
- National Food for Work Programme (NFWP)
- Sampoorna Grameena Rozgar Yojana (SGRY)
- Mahatma Gandhi National Rural Employment Guarantee Programme (MGNREGP): It provides guaranteed wage employment to every household whose one adult volunteer will get unskilled labour for a minimum of 100 days in a year.
All these programmes aim at providing not only employment but also services in areas such as primary health, primary education, rural drinking water, nutrition, assistance for people to buy income and employment generating assets, development of community assets by generating wage employment, assistance for constructing houses, laying of rural roads, development of wastelands.
XI. Answer any two of the following project oriented questions. ( 2 × 5 = 10 )
Question 47.
Write a note on SENSEX.
Answer:
Sensex is the short form for the of Bomba’ Stock Exchange Sensiti’.e Index with 1978-79 as a base. The value of the sensex is with reference to this period. It is the benchmark index for the
Indian stock market, It consists of 30 stocks that represent LS sectors of the economy and the companies listed are leaders in their respective industries. If the Sensex rises, it indicates that the market is doing cll and investors expect better earnings from companies. It also indicates growing confidence of investors in the basic health of the economy.
Further, the sensitive index is a market capitalization of weighted index of sample of large. well established and financially sound companies. It is the oldest index in India and has acquired a unique place in the collective consciousness of investors. This index is ide1v used to measure the performance of the Indian stock market. It is the pulse of the Indian capital market.
Question 48.
Write the chart of poverty line.
Answer:
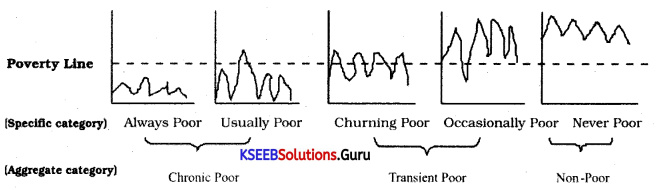
Chronic poor: These are the persons who always remain poor for a long period of time. For example. casual workers, agricultural laborers, rag pickers. beggars. etc. They include always poor and usually poor.
Transient poor: The transient poor are those people who are rich most of the time but may sometimes have a patch of bad luck. They also include churning poor who regularly move in and out of the poverty line example. small farmers and seasonal workers and occasionally poor who are rich most of the time.
Non-poor: These are the groups of people who live above the poverty line and they are never poor.
![]()
Question 49.
Prepare a list of causes of land degradation in India.
Answer:
Land in India suffers from varying degrees and types of degradation. These are increasing main due to the factors mentioned below:
(a) Deforestation, ie. reckless cutting down of trees resulting in loss of vegetation.
(b) Indiscriminate and over exploitation of forest products such as fuel wood and overgrazing.
(c) Conversion of forest lands into agricultural lands.
(d) Forest fire and faulty methods of cultivation.
(e) Excessive application of pesticides and insecticides.
(f) Disproportionate and excessive use of chemical fertilizers in Indian agriculture.
(g) The irrigation systems in india are not properly planned and managed.
(h) Overexploitation of ground water for various competing utilities like human settlement, industrialization, etc. .
(i) No proper introduction of crop rotation techniques and organic farming.
(j) Illiteracy and ignorance of rural population in respect of causes and effects of land degradation.
Land is indispensable for human settlement. If proper care is not taken for the conservation of land and water, there shall be severe scarcity of water and natural resources in future which may lead to conflict among the countries.