Students can Download 1st PUC Economics Model Question Paper 7 with Answers, Karnataka 1st PUC Economics Model Question Papers with Answers helps you to revise the complete Karnataka State Board Syllabus and score more marks in your examinations.
Karnataka 1st PUC Economics Model Question Paper 7 with Answers
Time: 3.15 Hours
Max Marks: 100
Instructions:
- Write the question numbers legibly in the margin.
- Answer for a question should be continuous.
Section – A
I. Choose the correct answer: ( 1 × 5 = 5 )
Question 1.
Economics is the study of mankind in of life.
(a) The ordinary business
(b) Extraordinary business
(c) The weekly business
(d) Special business
Answer:
(a) The ordinary business
Question 2.
Ogives can be helpful in locating graphically the
(a) Mode
(b) Mean
(c) Median
(d) None of these.
Answer:
(c) Median
Question 3.
Railway transport was introduced in India in the year
(a) 1835
(b) 1776
(c) 1850
(d) 1853
Answer:
(c)1850
![]()
Question 4.
Poverty line separates
(a) Poor and non-poor
(b) Rich and non-rich
(c) Poor and weak
(d) None of these
Answer:
(a) Poor and non-poor.
Question 5.
GDP stands for
(a) Gross domestic product
(b) Gross dollar price
(c) Gross domestic price
(d) None of these
Answer:
(a) Gross Domestic Product
II. Fill in the blanks: ( 1 × 5 = 5 )
Question 6.
Two ends of a class are called ___________
Answer:
Class limits
Question 7.
A measure that divides a series into hundred equal parts is called ____________
Answer:
Percentiles
Question 8.
Tax on the income of an individual is called ___________
Answer:
Direct tax.
Question 9.
Infrastructure facilities can be classified into types.
Answer:
Two
![]()
Question 10.
_________ country has the largest workforce in agriculture.
Answer:
India.
III. Match the following: ( 1 × 5 = 5 )
Question 11.
|
A |
B |
| 1. Pilot survey | (a) Consumer Price Index |
| 2. CPI | (b) Milk Production |
| 3. Quota | (c) Pretesting of questionnaire |
| 4. World Bank | (d) Quantity of goods that can be imported |
| 5. White Revolution | (e) India and knowledge economy |
Answer:
1-c,
2-a,
3-d,
4-e.
5-b.
IV. Answer the following questions in a word sentence: ( 1 × 5 = 5 )
Question 12.
What is dispersion?
Answer:
Dispersion refers to the extent to which values in a distribution differ from the average of the distribution
Question 13.
Why do we need statislical tools?
Answer:
Statistical tools are needed in our daily life and are used in the analysis of data pertaining to economic activities such as production. consumption. distribution, banking and insurance, trade. transport. etc.
![]()
Question 14.
Define jobless growth.
Answer:
During the late 1990s. employment growth started declining and reached the level of growth that India had in the early stages of planning. During thcse years. we also find a widening gap
Question 15.
Give the meaning of sustainable development.
Answer:
According to l3rundtland Commission. sustainable de elopment is the process of development which meets the needs of the present generation without compromising the ability of future generation to fleet their own needs”.
Question 16.
Which country lias the highest life expectancy?
Answer:
China.
Section – B
V. Answer any four of the following questions in four sentence each. ( 2 × 4 = 8 )
Question 17.
Mention the two sources of data,
Answer:
Primary data and secondary data are the two sou rccs of data,
Question 18.
Give the formula to find out midpoint.
Answer:
The formula to find out midpoint is as foIlos:
Mid point = \(\frac{\text { Upper class limit }+\text { Lower class limit }}{2}\)
Question 19.
How can you obtain a frequency curve?
Answer:
The frequency curve is obtained b drawing a smooth freehand cune passing through the points of the frequency polygon as closely as possible. It may not necessarily pass through all the points of the frequency polygon but it passes through them as closely as possible.
![]()
Question 20.
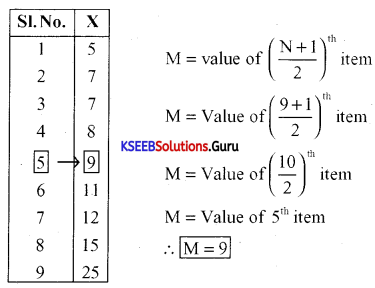
Calculate the value of the median from the following figures.
X: 5 7 9 12 11 8 7 15 25
Answer:
We need to put in ascending order
Question 21.
What is negative correlation? Give an example,
Answer:
The correlation is said be negative when the variables move in opposite directions.
Example:
- When the price of tomato increases, the demand for tomatoes decreases.
- More is the time spent for studies. less are the chances of failure,
Question 22.
Write the role of the questionnaire in developing a project.
Answer:
The collection of data by using the primary method can be done by using a questionnaire or an interview schedule which may be obtained by personal interviews, mailing or postal surveys. phone, email, etc, Preparation of a well-balanced questionnaire will help the process of research simple, fast and accurate, It becomes the record of what is actually surveyed.
VI. Answer any five of the following questions in four sentence each. ( 2 × 5 = 10 )
Question 23.
List out the important export goods of India before independence.
Answer:
The important export goods of India before independence were raw Silk, cotton, wool, sugar. indigo, jute. etc.
Question 24.
Who are the rural poor? Give example.
Answer:
Rural poor are those people who live in villages without basic needs. Example land less labourers. Even if some have land. it is on I dry or aste land. Many do not get even two meals a day. They borrow from moneylenders or landlords who charge high rates of interest that leads to rural indebtedness.
![]()
Question 25.
State the meaning of human capital.
Answer:
Human capital refers to that part of population that possesses skills. kno ledge. education and experience. It also includes the ability of human beings to give their best and their ability to create economic alue for thìns.
Question 26.
Name the institutional sources of rural credit.
Answer:
The institutional sources of niral credit are as folÍows:
- Commercial Banks
- Regional Rural Banks (RRBs)
- Cooperative Societies
- Land Deeloprnent Banks.
Question 27.
What is unemployment according to NSSO?
Answer:
According to National Sample Survey Organisation (NSSO), imemployment is a situation in which all those who, owing to lack of work, are not working but either seek work through employment exchanges, intermediaries, friends or relatives or by making applications to prospective employers or express their willingness or availability for work under the prevailing condition of work and remunerations.
Question 28.
What are the components of Indian systems of medicines?
Answer:
The components of Indian systems of medicine (AYUSH) are as follows:
- Avurveda.
- Yoga
- Unani
- Siddha
- Naturopathy
- Homeopathy.
![]()
Question 29.
Give the meaning of biopest control. Give examples.
Answer:
Bio-pest control is a method of using pesticides based on plant products and spreading awareness about various animals and birds which help in controlling pests. For example.
. Neem trees are useful to control pests, mixed cropping and growing different crops in successive years on the sanie land also helps.
. Snakes arc one of the important groups of animals which devour rats, mice and various other pests, as their food.
Similarly, large varieties of birds like owls and peacocks. pray upon vermin and pests. if these are allowed to dwell around the agricultural land, they can clear a large amount of pests including insects. Frogs and lizards are also usefùl in their regard.
Section – C
VII. Answer any three of the following questions in twelve sentence each. ( 3 × 4 = 12 )
Question 30.
Briefly explain how statistics help to study economics.
Answer:
Statistics plays a very important role in the field of economics. It helps in the study of economics in many ways:
(a) It helps to understand economic problems: B using various statistical tools, effort is being made to find the causes behind the economic problems with the help of qualitative and the quantitative facts, Once the causes of a problem are identified, it is easier to formulate certain policies to tackle them.
(b) It enables an economist to present economic facts in a precise and definite form: Statistics help the economists to present economic facts with accuracy. It also helps in proper comprehension of what is stated in the subject matter. When economic facts are expressed in statistical terms, they become exact. Exact facts are more convincing than vague statements. For instance, saving 350 people have died in Kashmir unrest since 2000, is more accurate than saving that a lot of people have died in the unrest.
(c) Helps in condensing mass data into a few numerical measures: Statistics condenses the mass data into a few numerical measures like mean, variance, correlation, etc. These numerical measures help to summarise data. For example. it would be impossible to remember the income of all the people of a country. But we can remember average income i.e., per capita income.
(d) It is used to find relationships between different economic factors: An economist may be interested in finding out what happens to the demand for a commodity when its price changes or what i1l be impact on inflation, when the government has more budget deficits. Such situations can be dealt, if any relationship exists between the various economic factors. Here, the nature of relationship can be studied with the help of statistical tools.
(e) It helps in formulation of plans and policies: Sometimes, formulating plans and policies require the knowledge of future trends. For instance, an economic planner has to decide in 2010 how much the economy should produce in 2016-17. In other words, one must know what could be the expected level of consumption in 20 16-17. So. the statistical tools to predict consumption in 2016-17 could be based on the data of consumption of past years obtained by surveys.
![]()
Question 31.
Does sample survey provide better results than census? Give reasons for your answer.
Answer:
Yes. sample&sun’ey provide better results than census.
A sample refers to a group or section of the population from which information is to be obtained.
A good sample is generally smaller than the population and is capable of providing reasonably accurate information about the population at a much lower cost and shorter time.
Suppose you want to studs’ the average income of people in a particular state. according to the census method. we need to find out the income of even individual in the region, add thcrn up and divide by number of individuals to get the average inconic of people in the state, This method would require huge expenditure. as a large number of investigators are to be employed.
Altematively if a represcntatie sample of few individuals is selected from the state to find their inCome, it saves time. money and energy in the process of determination of income.
To sum up, sampling is considered a better method due to following reasons:
- It is more economical than the other techniques of collection of data
- Sample investigation can be done at a greater speed as it consumes less time
- When sampIig is conducted scientifically and carefully, it gives accuracy
- Planning. organ1ation and supervision can be conveniently managed which leads to administrative conveniencc.
Question 32.
Write a note on classification of data.
Answer:
The raw data are classified in various ways depending on the purpose. Generally, data can be
classified as follows:
(a) Chronological classification: When the data is grouped according to time, it is called as chronological classification. In such a classification, data are classified either in ascending or in descending order with reference to time such as years. quarters. months weeks days. etc.
(b) Spatial classification: if the data are classified with reference to geographical locations such as countries. states. cities. districts. etc.. it is called spatial classification.
(c) Qualitative classification: Vhcn the data arc classified on the basis of certain attributes or qualities like literacy. religion. gender. marital status etc.. then it is called qualitative classification. These attributes can be classified on the basis of either the presence or the absence of a qualitative characteristic.
(d) Quantitative classification: If the classification of data is done on the basis of certain characteristics like height. weight. age. income, marks of students etc., it is called as quantitative classification.
![]()
Question 33.
The yield of wheat per acre for 10 districts of one as state is under:

Answer:
First we need to write the yield of wheat in arc ascending order
x: 9 10 10 12 15 16 18 19 21 25
Median Size of \(\left(\frac{N+1}{2}\right)^{t h}\) item
= Size of \(\left(\frac{10+1}{2}\right)^{\text {th}}\) item
= Size of \(\left(\frac{11}{2}\right)^{t h}\) item
= Size of 55th item
To get median. we need to add the’ 5th and 6th items and the same divided b 2.
Median= \(\frac{5^{\text {th }} \text { item }+6^{\text {th }} \text { item }}{2}=\frac{15+16}{2}=\frac{31}{2}\) =15.5
Median = 15.51
Calculation of mean deviation from median
Mean deviation from median (MDM)
MDM = \(\frac{\Sigma|\mathrm{D}|}{\mathrm{N}}=\frac{43}{10}\) = 4.3
∴ IMDM = 4.3 tonnes
Question 34.
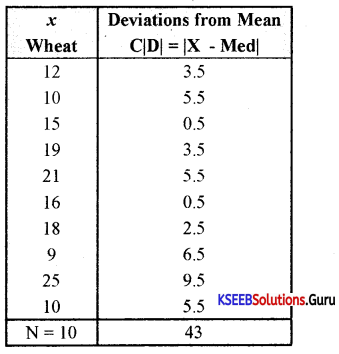
Draw a scatter diagram and interpret.

Answer:
Interpretation: There is a perfect positive correlation between X and Y.
VIII. Answer any four of the following questions in twelve sentence each: ( 4 × 4 = 16 )
Question 35.
What do you understand by the ‘Drain of Indian wealth’ during colonial period?
Answer:
The most important feature of 1ndias foreign trade during British rule was the generation of a large export surplus. That means Indias exports exceeded its imports. It resulted in disadantage to the countrvs economy.
The essential commodities were not made available to Indians as the’ were exported to Britain in large quantities ignoring domestic needs.
The export surplus (value of exports being greater than the value of imports) was used to make payments for the expenses incurred by an office set up by the colonial government in Britain, expenses on war, again fought by the British Government and the import of invisible items.
This is known as Drain of Indian health.
![]()
Question 36.
Give the meaning and importance of small scale industries.
Answer:
A small scale industry is defined with reference to the maximum inestment allowed on the assets of a production unit, A small scale industry is one where the investment is less than one crore rupees.
Small scale industries play a veiy important role in the economic development of India. It is a known fact that small scale industries are more labour intensive i.e.. they use more labour than the large scale industries and therefore, generate more employment.
Apart from the above, the small scale industries require less capital as they are small units. The are free from industrial unrest. They also depend on indigenous resources and need not depend on foreign resources. Small scale industries were also given concessions like lower excise dut and bank loans at lower interest rates.
Question 37.
Write a note on outsourcing.
Answer:
Outsourcing is a process in which a company hires regular service from external sources, usually from other countries, which was previously provided internally. It includes legal advice, computer service, advertisement, security, etc.
As a form of economic activity, outsourcing has intensified in recent years due to fast mode of the communication network. Many services like voice based business processes. record-keeping. accountancy, banking services, music recording. film editing. book transcription, clinical advice or e en teaching are being outsourced by companies in developed countries to India. The modem telecommunication links like internet. the text, voice and visual data in respect of these services is digitized and transmitted throughout the world. Most of the multinational corporations and small companies are outsourcing their services to India where they can be availed at a cheaper cost. The low wage rates and availability of skilled labour in India have made it a favorite destination for global outsourcing.
![]()
Question 38.
Explain the drawbacks of the agriculture market.
Answer:
Agricultural marketing is a process that involves assembling, storage, processing, transportation. packaging, grading and distribution of different agricultural commodities across the country. The major drawbacks of agriculture marketing in India are as follows:
- Long chain of middlemen taking away the profit of farmers
- No proper storage facilities to protect the agricultural products
- Faulty methods of weighing/reasoning agricultural crops
- Manipulation of accounts
- Farmers are forced to sell their products at low prices due to lack of information.
Question 39.
Write a short note on women health in India.
Answer:
Women constitute about 50% of the total population in India. They suffer many disadvantages as compared to men in the areas of education, participation in economic activities and health care.
The decline in the child sex ration in the country from 927 in 2001 to 914 in 2011, points to the growing incidence of female foeticide in the country. Close to 3 lakh girls under the age of 15 are not only married but have already borne children at least once. More than 50 % of married women between the age group of 15 to 49 have anemia and nutritional anemia caused by iron deficiency. which has contributed to 19% of maternal deaths. Frequent abortions are also a major cause of maternal morbidity and mortality in India.
![]()
Question 40.
What are the various indicators of human development?
Answer:
The various indicators of human development are as follows:
(a) Human development index: It consists of standard of living index, life expectancy at birth and educational attainment. If the HDI is high it is good indicator of human development.
(b) Life expectancy at birth: It is the average number of years a person is expected to live. In other words. it is the longevity of life. A high vaLue of life expectancy better indicates a quality human development.
(c) Adult literacy rate: It is the average number of persons who have reading and writing skills with basic local knowledge. It is expressed in percentags. The high literacy rate shows high human development.
(d) GDP per capita: The gross domestic product per head is also one of the indicators of human development. The high value of GDP per capita indicates better human development.
(e) Infant mortality rate: It means the death of babies per thousand live births. If the IMR is high it indicter’s low human development.
(f) Maternal mortality rate: It shows the death of mothers per 1 Iakh live births. If MMR is low, it indicates a better human development.
(g) Population using improved sanitation: ¡f the percentage of population using improved sanitation is more, it is a good indicator of human development.
(h) Population with sustainable access to improved water sources: 1f the percentage of the population using sustainable access to improved water source is high, it is a good indicator of human development.
(i) People living below poverty line: If less people are living below poverty line, then it is a good indicator of human development.
(j) Percentage of children undernourished: If the number of undernourished children is diminishing, then it is a good indicator of human development.
Section – D
IX. Answer any two of the following questions in about twenty sentence each. ( 2 × 6 = 12 )
Question 41.
What is tabulation? What are the parts of a table? Explain.
Answer:
When data is represented in rows and columns, it is called tabulation. To construct a table, it is important to know the different components of a good statistical table. When all the components are put together systematically, they form a table.
Tabulation can be done using one way. two way or three way classification depending upon the number of characteristics involved.
A good table should have the following parts:
(a) Table number: Table number is given to a table for identification purpose. If more than one table is presented, it is the table number that distinguishes one table from another. It is given at the top or at the beginning of the title of the table.
(b) Title: The title of the table gives about the contents of the table. It has to be very clear, brief and carefully worded, so information interpretations made from the table are clear and free from anv confusion.
(c) Captions: These are the column headings given as designations to explain the figures of the column.
(d) Stubs: These are headings given to row s of the table. The designations of the row-s are also called stubs or stub items and the left column is known as stub column.
(e) Body of the table: It is the main part and it contains the actual data. Location of anyone data in the table is fixed and determined by the row and column of the table.
(f) Headnote/Unit of measurement: The units of measurement of the figures in the table should always be stated along with the title. If figures are large, they should be rounded off and the method of rounding should be indicated.
(g) Source: It is a brief statement or phrase indicating the source of data presented in the table. If more than one source is there, all the sources are to be mentioned.
(h) Note: It is the last part of the table. It explains the specific feature of the data content of the table which is not self-explanatory and has not been explained earlier.
Question 42.
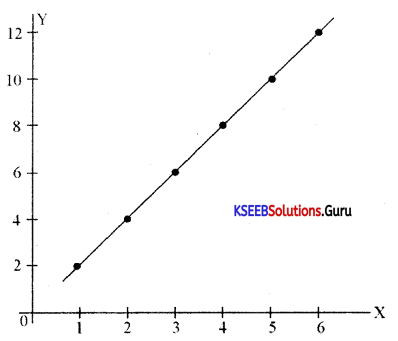
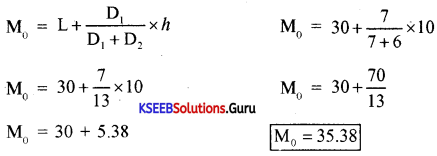
Calculate mode from the following distribution.

Answer:
By seeing the frequency column, we can make out that the class interval 30-40 is considered as the modal group. To find out exact mode the following formula is used.
![]()
Question 43.
Calculate the SD of the following frequency distribution of heights of 30 persons by direct method.
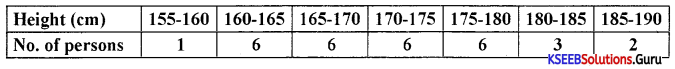
Answer:
X. Answer any two of the following questions in about twenty sentence each. ( 2 × 6 = 12 )
Question 44.
Briefly explain the important areas of liberalization.
Answer:
Liberalisation was one of the reforms of the New Economic Policy of 1991. It was introduced to put an end to the restrictions and open up various sectors of the economy.
The following are the important areas of liberalization:
(a) Deregulation of the industrial sector: The liberalization policy removed many restrictions enforced on the industrial sector. Industrial licensing was abolished for almost all but product categories like alcohol, cigarettes, hazardous chemicals, industrial explosives, electronics, aerospace and drugs and pharmaceuticals. The only industries which are not reserved for the public sector are defense equipment, atomic energy generation and railway transport. Many goods produced by the small-scale industries have now been deserved.
(b) Financial sector reforms: The financial sector consists of financial institutions like commercial banks, investment banks, stock exchange operations and foreign exchange markets.
The financial sector in India is regulated by the Reserve Bank of India. The RBI decides the amount of money that the banks can keep with themselves, fixes interest rates, nature of lending to various sectors, etc.
The major objective of financial sector reforms is to reduce the role of RBI from the regulator to facilitator of the financial sector. That means the financial sector may be allowed to take decisions on many matters independent of RBI.
The financial sector reform policies led to the establishment of private sector banks both Indian and foreign. Foreign investment limit in banks was raised to around 50%. The banks which fulfill certain conditions have been given the freedom to set up new branches without the approval of the RBI. Foreign institutional investors (FII) like merchant bankers, mutual funds and pension funds are now allowed to invest in Indian financial markets.
(c) Tax reforms: These are the reforms that are concerned with the government’s taxation and public expenditure policies which are collectively known as its fiscal policy. There are two types of taxes, direct and indirect.
Since 1991, there has been a continuous reduction in the taxes on individual incomes as it was felt that high rates of income tax were an important reason for tax evasion. It is now widely accepted that moderate rates of income tax encourage savings and voluntary disclosure of income.
The rate of corporation tax (tax on income of companies) which was very high earlier has been gradually reduced. A new tax called Goods and Services Tax (GST) has been introduced from 1.7.2017 to bring uniformity in indirect taxes.
In order to encourage better compliance on the part of tax payers, many procedures have been simplified and the rates also substantially lowered.
(d) Foreign exchange reforms: During 1991, the Government took an immediate measure to resolve the balance of payments crisis, the rupee was devalued against foreign currencies. This led to an increase in the inflow of foreign exchange. It also set the tone to free the determination of rupee value in the foreign exchange market from government control. At present, the market forces i.e., demand and supply, determine the exchange rates.
(e) Trade and investment policy reforms: A new trade and investment policy under liberalization strategy was made to increase international competitiveness of industrial production and a foreign investments and technology into the economy. The aim was also to promote the efficiency of the local industries and the adoption of modem technologies.
To protect Indian industries, the government was following quantitative restrictions on imports which encouraged tight control over imports. At the same time, tariffs were very high. These policies reduced efficiency and competitiveness which led to a slower growth of the manufacturing sector.
The main objectives of Trade and Investment Policy were:
- To remove quantitative restrictions on imports
- To reduce quantitative restrictions in exports
- Reducing tariff rates
- Removal of licensing system.
Import licensing was abolished except in case of hazardous and environmentally sensitive industries. Quantitative restrictions on imports of manufactured consumer goods and agricultural products were also fully removed.
Export duties have been removed to increase the competitive position of Indian goods in the international markets.
A process of disinvestment was also initiated by selling of part of equity shares of public sector enterprises to the public.
![]()
Question 45.
Examine the role of education in the economic development of a nation.
Answer:
Education plays a predominant role in economic development of India in the following
ways:
(a) it modernizes the attitude and behaviour of the people: Education brings favourable changes in the attitude and behaiourofpcoPlC. It gives inputs like hat is right and what is wrong and contributes for taking sound and valuable judgments.
(b) Promotes science and technology: Educational was provided the knov ledge about latest technology to people who know reading and writing. It explains the new methods of production through innovations in various sectors of the economy. By providing scope for latest techniques of production. it develops agriculture, industry, transport, power. etc.
(c) Increases mobility of labours: Education helps the labourers to search for more rewarding employment opportunities all over the world. It helps to chooses a suitable career according to one’s educational qualifications. It makes them to move from country to country or state to state as and when required.
(d) Creates national and developmental consciousness: Education creates civic, national and developmental consciousness among the literates. It provides information about the past events in History and tells about the freedom struggle of great national leaders like Mahatma Gandhi, Bhagath Singh, Subhas Chandra Bose and others. It makes people to develop a sense of patriotism and helps them to adopt strategies of progress in life.
(e) Contributes to skilled and trained workers: Education generates skilled and trained labour force needed for the development of the country. Education includes both general and technical education. The general education includes Bachelor of Arts. Bachelor of Commerce, Bachelor in Business Administration, etc. at the degree level and technical education includes Bachelor in Engineering in different streams like mechanical, civil, electronic, electrical, computer, etc. All these contribute for the supply of skilled labour for tlie overall development of the country.
(f) Act as source of knowledge: Education is a house of knowledge for all purposes. Any¬thing to know we need to be literate. It helps people to take decisions on the basis of their knowledge gained in different stages while getting education.
(g) Develops moral values: As education provides number of stories and incidents people’s lives, people can definitely develop moral values. These moral values are included in their daily life. Some of the moral values arer not to sell adulterated products, in case of seller and in case of buyer, not to create inconvenience for others in their routine life and so on.
(h) Creates awareness about culture and politics: Education always provides complete information about cultural heritage of any nation. It explains how they are constructed with the investment of money and human capital. It helps them to preserve historical monuments, inscriptions and other valuable items. It also provides day-to-day information about politics when the person is literate.
Question 46.
What do you mean by organized sector? Discuss the reasons for fall in employment in the organized sector.
Answer:
The organized sector is that sector which includes all the Public Sector Establishments and those Private Sector Establishments which employ 10 or more hired workers. They are called formal sector or organized sector establishments and those who work ¡n such establishments are formal sector workers or organized labour.
The following are the major reasons for the decline in employment opportunities in organized sector:
- Lack of initiative from the government in creating new employment opportunities
- Industrial sickness has made Public Sector Industries to cut down on their vacancies
- The migratory character of the workforce
- The strict labour laws have made Public Sector Enterprises to go for formalisation of labour which has resulted in a decline in emp1oymnt opportunities
- Privatization and Disinvestment have made decrease in jobs in the public sector.
- Amalgamation amid merger among large scale industries have led to decrease in employment opportunities
XI. Answer any two of the following project oriented questions. ( 2 × 5 = 10 )
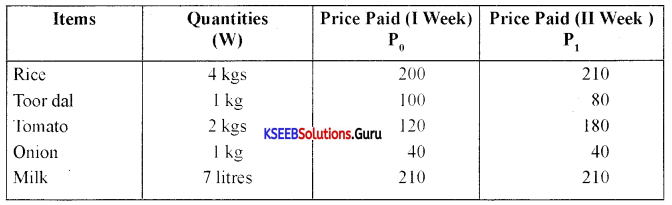
Question 47.
Record the daily expenditure, the quantity bought and prices paid per unit of the daily purchases, such as rice, toor dal, tomato, onion and milk of your family for two weeks.
How has the price change affected your family?
Answer:
The following table shows the list of items with quantities purchased by a family:
No need to calculate CPI by calculating price relatie with the help of formulae.
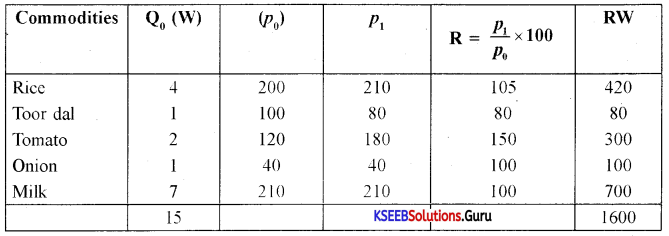
Calculation of Living Index or Consumer Price Index is calculated as follows:
CPI = \(\frac{\Sigma \mathrm{WP}}{\Sigma \mathrm{W}}=\frac{1600}{15}\) = 106.66
CPI = 106.66
Comment: It shows that there is an increase in price by 6.66°c. which has a little effect on standard of 1iing,
![]()
Question 48.
Suppose you are a resident of a village, suggest a few measures to tackle the problem of poverty.
Answer:
Poverty has become a major challenge in rural economy of India. As a resident of a village I can suggest the following measures to tackle the problem of poverty:
- Providing free and compulsory education to each and every individual in rural areas
- Supplying agricultural inputs like seeds, chemical fertilizers, etc. to farmers at subsidized rates
- Removal of all defects of agricultural marketing
- Creating self-employment opportunities
- Provision of transport and communication facilities to rural areas
- Arranging banking facilities so that the fanners get sufficient crop loans at low rate of interest ‘
- Encouraging agriculture allied activities like poultry farming, dairy farming, beekeeping, sericulture, horticulture, etc.
- Encouraging change in crop pattern, mixed farming, and adopting scientific methods to grow crops
- Provision of free health care facilities
- Continuous supply of electricity to all pump sets at free of cost
- Supply of essential commodities to landless labourers, small and marginal farmers
- The government should provide all necessary infrastructural facilities for the overall development of rural economy.
Question 49.
Prepare a list of causes of land degradation in India.
Answer:
Land in India suffers from varying degrees and types of degradation. These are increasing mainly due to the factors mentioned below:
(a) Deforestation, ie, reckless cutting down of trees resulting in loss of vegetation.
(b) Indiscriminate and over-exploitation of forest products such as fuelwood and overgrazing.
(c) Conversion of forest lands into agricultural lands.
(d) Forest fire and faulty methods of cultivation.
(e) Excessive application of pesticides and insecticides.
(f) Disproportionate and excessive use of chemical fertilizers in Indian agriculture.
(g) The irrigation systems in India are not properly planned and managed.
(h) Overexploitation of groundwater for various competing utilities like human settlement, industrialization, etc.
(1) No proper introduction of crop rotation techniques and organic farming.
(j) Illiteracy and ignorance of rural population in respect of causes and effects of land degradation.
The land is indispensable for human settlement. If proper care is not taken for the conservation of land and water, there shall be a severe scarcity of water and natural resources in the future which may lead to conflict among the countries.