KSEEB SSLC Class 10 Maths Solutions Chapter 13 Statistics Ex 13.2 are part of KSEEB SSLC Class 10 Maths Solutions. Here we have given Karnataka SSLC Class 10 Maths Solutions Chapter 13 Statistics Exercise 13.2.
Karnataka SSLC Class 10 Maths Solutions Chapter 13 Statistics Exercise 13.2
Question 1.
The following table shows the ages of the patients admitted in a hospital during a year :
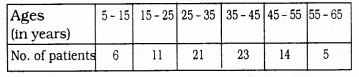
Find the mode and the mean of the data given above. Compare and interpret the two measures of central tendency ?
Solution:
(i) Here the maximum class interval is 35 – 45. This class interval has mode
l = 35, f1 = 23, f0 = 21, f2 = 14, h = 10
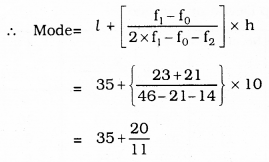
∴ Mode = 36.8 years
(ii) Mean (\(\overline{X}\)) : Step Deviation Method:
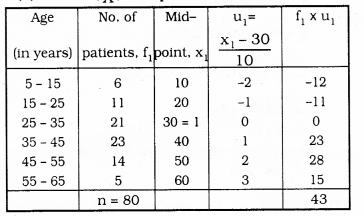
Here, a = 30
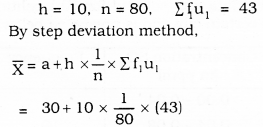
= 30 + 5.37
= 35.37
∴ Mode = 36.8
∴ Mean = 35.37
Hence Age group 36.8 patients are admitted more in number.
Mean age group patients are 35.57
Question 2.
The following data gives the information on the observed lifetimes (in hours) of 225 electrical components:
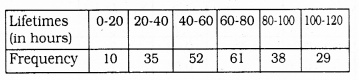
Determine the modal lifetimes of the components:
Solution:
Class interval which has mode = 60 – 80
Here, l = 60, f1 = 61, f0 = 52, f2 = 38, h = 20
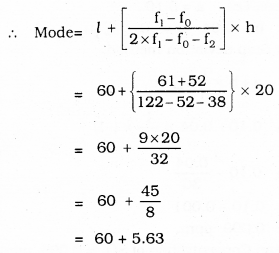
∴ Mode = 65.63 Hours
Question 3.
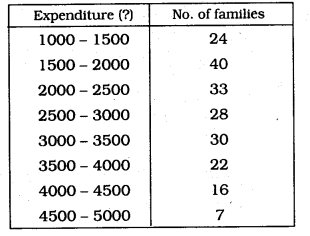
The following data gives the distribution of total monthly household expenditure of 200 families of a village. Find the modal monthly expenditure of the families. Also. And the mean monthly expenditure :
Solution:
Solution:
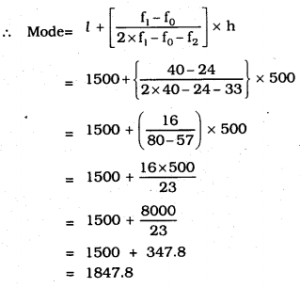
(i) Mode is in class interval 1500 – 2000
Here, l = 1500, f1 = 40, f0 = 24, f2 = 33, h = 500
(ii) Mean (\(\overline{X}\)): Step Deviation Method:
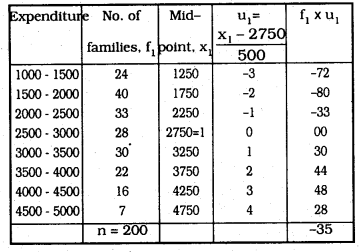
Here, a = 2750
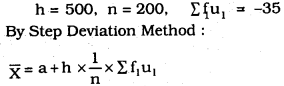
= 2750 – 87.50
= 2662.5
∴ Modal monthly expenditure = 1847.8
∴ Mean Monthly expenditure = Rs. 2662.5
Question 4.
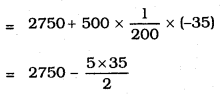
The following distribution gives the state- wise teacher-student ratio in higher secondary schools of India. Find the mode and mean of this data. Interpret the two measures.
Solution:
(i) Class interval which has mode 30 – 35
Here, l = 30, f1 = 10, f0 = 9, f2 = 3, h = 5
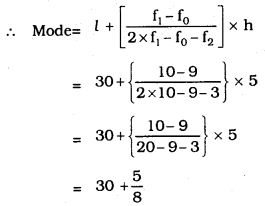
∴ Mode = 30.6
(ii) Mean (\(\overline{X}\)) : Step Deviation Method :
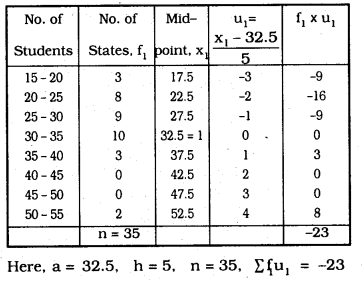
By Step Deviation Method:
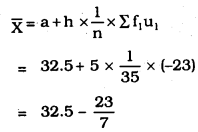
= 32.5 – 3.3
= 29.2
∴ Mode = 30.6
∴ Mean = 29.2
We conclude that more number of states has teacher-student ratio about 30.6.
Mean of Age ratio is 29.2.
Question 5.
The given distribution shows the number of runs scored by some top batsmen of the world in one-day international cricket matches.
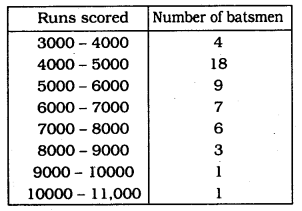
Find the mode of the data.
Solution:
Class interval which has mode is = 4000 – 5000
Maximum frequency is
Here, l = 4000, f1 = 18, f0 = 4, f2 = 9, h = 1000
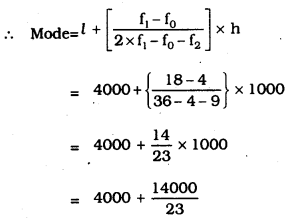
= 4000 + 608.7
= 4608.7
∴ Mode = 4608.7 runs.
Question 6.
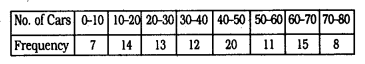
A student noted the number of cars passing through a spot on a road for 100 periods each of 3 minutes and summarised it in the table given below. Find the mode of the data :
Solution:
Class interval which has mode is 40- 50
Maximum frequency is 20.
Here, l = 40, f1 = 20, f0 = 12, f2 = 11, h = 10
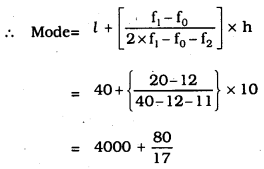
= 40 + 4.7
= 44.7
∴ Mode = 44.7 cars.
We hope the given KSEEB SSLC Class 10 Maths Solutions Chapter 13 Statistics Ex 13.2 will help you. If you have any query regarding Karnataka SSLC Class 10 Maths Solutions Chapter 13 Statistics Exercise 13.2, drop a comment below and we will get back to you at the earliest.