KSEEB Solutions for Class 9 Maths Chapter 14 Statistics Ex 14.2 are part of KSEEB Solutions for Class 9 Maths. Here we have given Karnataka Board Class 9 Maths Chapter 14 Statistics Exercise 14.2.
Karnataka Board Class 9 Maths Chapter 14 Statistics Ex 14.2
Question 1.
The blood groups of 30 students of Class VIII are recorded as follows :
A, B, O, O, AB, O, A, O, B, A, O, B, A, O, O
A, AB, O, A, A, O, O, AB, B, A, O, B, A, B. O
Represent this data in the form of a frequency distribution table. Which is the most common, and which is the rarest, blood group among these students?
Answer:
The blood groups of 30 students of class VIII are as follows
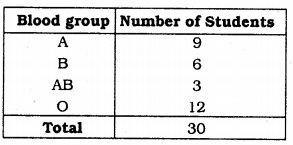
i) Out of 30 students only three students have blood group AB. This is rarest blood group.
ii) Most common blood group students are 12. Hence ‘O’ is the maximum blood group.
Question 2.
The distance (in km) of 40 engineers from their residence to their place of work were found as follows :
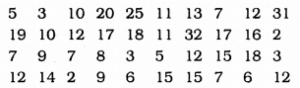
Construct a grouped frequency distribution table with class size 5 for the data given above taking the first interval as 0 – 5 (5 not included). What main features do you observe from this tabular representation ?
Solution:
Size of the class interval = 5
First class interval is 0 – 5 (5 is not included).
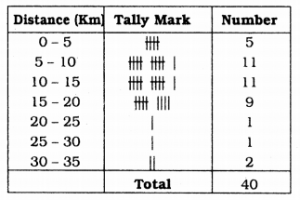
More number of people, i.e. 5 to 15 Km come.
Question 3.
The relative humidity (in %) of a certain city for a month of 30 days was as follows:
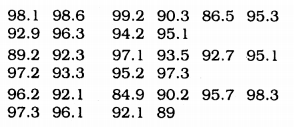
(i) Construct a grouped frequency distribution table with classes 84 – 86, 86 – 88, etc.
(ii) Which month or season do you think this data is about ?
(iii) What is the range of this data ?
Solution:
Size of class interval = 2
(i) Frequency distribution table :
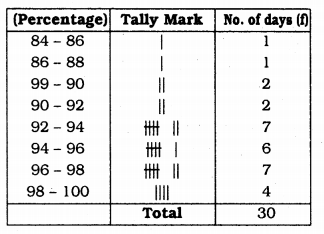
(ii) Relative humidity is more, these data are taken during rainy season.
(iii) Maximum humidity = 99.2
Minimum humidity = 84.0
∴ Range = Maximum – Minimum
= 99.2 – 84.9
= 14.3
Question 4.
The heights of 50 students, measured to the nearest centimetres, have been found to be as follows :
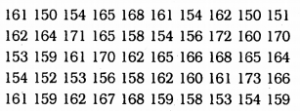
(i) Represent the data given above by a grouped frequency distribution table, taking the class intervals as 160 – 165, 165 – 170, etc.
(ii) What can you conclude about their heights from the table ?
Solution:
Maximum height : 150 cm.
Minimum height : 173 cm.
Size of class interval = 5
(i) Frequence distribution table for grouped data:
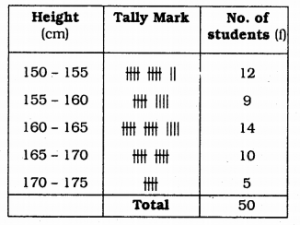
(ii) Referring to above table, 50% students have height less than 165 cm.
Height of majority students is 160 – 165 cm.
Question 5.
A study was conducted to find out the concentration of sulphur dioxide in the air in parts per million (ppm) of a certain city. The data obtained for 30 days is as follows
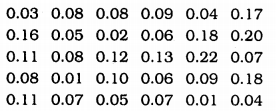
(i) Make a grouped frequency distribution table for this data with class intervals as 0.00 – 0.04, 0.04 – 0.08, and so on.
(ii) For how many days, was the concentration of sulphur dioxide more than 0.11 parts per millon ?
Solution:
(i) Grouped frequency distribution table:
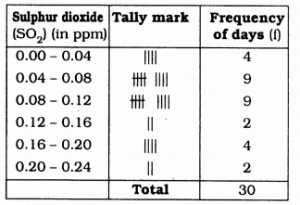
(ii) In 8 days the concentration of sulphur dioxide is more than 0.11 parts per million.
Question 6.
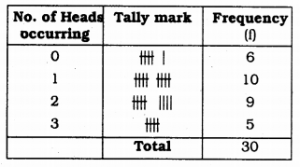
Three coins were tossed 30 times simultaneously. Each time the number of heads occurring was noted down as follows :
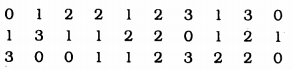
Prepare a frequency distribution table for the data given above.
Solution:
Frequency distribution table :
Question 7.
The value of n upto 50 decimal places is given below :
3.14159265358979323846264338327950288419716939937510
(i) Make a frequency distribution of the digits from 0 to 9 after the decimal point.
(ii) What are the most and the least frequently occurring digits ?
Solution:
Frequency distribution table :
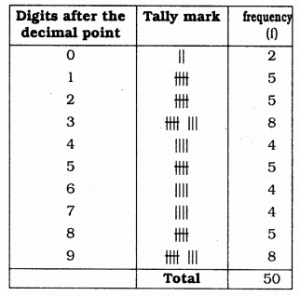
(ii) Digits which have more frequency are 3 and 9.
‘0’ is the digit which has less frequency.
Question 8.
Thirty children were asked about the number of hours they watched TV programmes in the previous week. The results were found as follows :
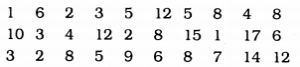
(i) Make a grouped frequency distribution table for this data, taking class width 5 and one of the class intervals as 5 – 10.
(ii) How many children watched television for 15 or more hours a week ?
Solution:
(i) Size of Class Interval = 5
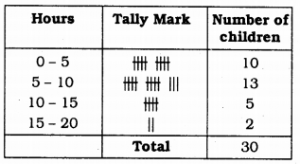
(ii) Number of children watched TV for 15 days or more hours a week is 2.
Question 9.
A company manufactures car batteries of a particular type. The lives (in years) of 40 such batteries were recorded as follows :
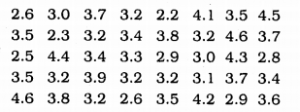
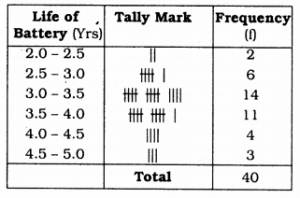
Construct a grouped frequency distribution table for this data, using class intervals of size 0.5 starting from the interval 2 – 2.5.
Solution:
Size of the class interval = 0.5
Class interval : 2 – 2.5, 2.5 – 3 …….
Grouped Frequency distribution table:
We hope the KSEEB Solutions for Class 9 Maths Chapter 15 Statistics Ex 14.2 helps you. If you have any query regarding Karnataka Board Class 9 Maths Chapter 15 Statistics Exercise 14.2, drop a comment below and we will get back to you at the earliest.