Students can Download Maths Chapter 13 Statistics Ex 13.3 Questions and Answers, Notes Pdf, KSEEB Solutions for Class 8 Maths helps you to revise the complete Karnataka State Board Syllabus and score more marks in your examinations.
Karnataka Board Class 8 Maths Chapter 13 Statistics Ex 13.3
Question 1.
Runs scored by 10 batsmen in a one-day cricket match are given. Find the average run scored. 23, 54, 08, 94, 60, 18, 29, 44, 05, 86
Answer:
Σ x = 23 + 54 + 08 + 94 + 60 + 18 + 29 + 44 + 05 + 86 = 421
N = 10
Average = Mean =

Question 2.
Find the mean weight form the following table:
| Weight (kg) | 29 | 30 | 31 | 32 | 33 |
| No. of children | 02 | 01 | 04 | 03 | 05 |
Answer:
| Weigh t(kg) | No. of children(x) | ‘ f |
| 29 | 02 | 58 |
| 30 | 01 | 30 |
| 31 | 04. | 124 |
| 32 | 03 | 96 |
| 33 | 05 | 164 |
| N= 15 | Zf = 473 |
Mean = \(\frac{\Sigma f_{X}}{N}=\frac{473}{15}=31.53\)
Question 3.
Calculate the mean for the following frequency distribution.
| Mark | 10-20 | 20-30 | 30-40 | 40-50 | 50-60 | 60-70 | 70-80 |
| Frequency | 3 | 7 | 10 | 6 | 8 | 2 | 4 |
Answer:
| Marks | Frequency | Midpoint | fx |
| 10-20 | 3 | 15 | 45 |
| 20-30 | 7 | 25 | 175 |
| 30-40 | 10 | 35 | 350 |
| 40-50 | 6 | 45 | 270 |
| 50-60 | 8 | 55 | 440 |
| 60-70 | 2 | 65 | 130 |
| 70-80 | 4 | 75 | 300 |
| N = 40 | Efx = 1710 |
Mean = \(\frac{\Sigma f_{x}}{N}=\frac{1710}{40}=42.75\)
Question 4.
Calculate the mean for the following frequency distribution.
| Mark | 15-19 | 20-24 | 25-29 | 30-34 | 35-39 | 40-44 |
| Frequency | 6 | 5 | 9 | 12 | 6 | 2 |
Answer:
| Marks. | Frequency | Midpoint | f(X) |
| 15-19 | 6 | 17 | 102 |
| 20-24 | 5 | 22 | *110 |
| 25-29 | 9 | 27 | 243 |
| 30-34 | 12 | 32 | 384 |
| 35-39 | 6 | 37 | 222 |
| 40-44 | 2 | 42 | 84 |
| N = 40 | Efx = 1145 |
Mean = \(\overline{X}=\frac{\Sigma f_{X}}{N}=\frac{1145}{40}=28.625\)
Question 5.
Find the median of the data 15,22, 9,20, 6,18,11,25,14.
Answer:
6, 9, 11, 14,(15), 18, 20, 22,25 (Ascending order)
N = 9,
Median = 15.

Question 6.
Find the median of the data 22,28,34, 49, 44, 57,18,10,33, 41, 66, 59.
Answer:
10, 18, 22, 28, 33, 34, 41, 44, 49, 57, 59, 66 (Ascending order)
N = 10
∴ Median =

Question 7.
Find the median for the following frequency distribution table.
| Class interval | 110-119 | 120-129 | 130-139 | 140-149 | 150-159 | 160-169 |
| Frequency | 6 | 8 | 15 | 10 | 6 | 5 |
Answer:
| Class interval | Frequency (f) | Cumulative frequency (fc) |
| 110-119 | 6 | 6 |
| 120-129 | 8 | 14 |
| 130-139 | 15 | 29 |
| 140-149 | 10 | 45 |
| 160-169 | 5 | 50 |
| N = 50 |
N = 50
\(\frac{\mathrm{N}}{2}=\frac{50^{25}}{\not 2}=25\)
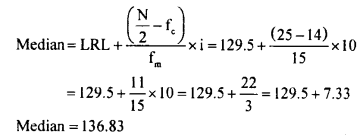
∴ Median class is 130 – 139
LRL = 129.5
Fc = 14
Fm = 15
i = 10
Question 8.
Find the median for the following frequency distribution table.
| Class interval | 0-5 | 5-10 | 10-15 | 15-20 | 20-25 | 25-30 |
| Frequency | 5 | 3 | 9 | 10 | 8 | 5 |
Answer:
| Class interval | Frequency (t) | Cumulative frequency (fc) |
| 0-5 | 5 | 5 |
| 5-10 | 3 | 8 |
| 10-15 | 9 , | 17 |
| 15-20 | 10 | 27 |
| 20-25 | 8 | 35 |
| 25-30 | 5 | 40 |
| N = 40 |
N = 40
\(\frac{N}{2}=\frac{40}{2}=20\)
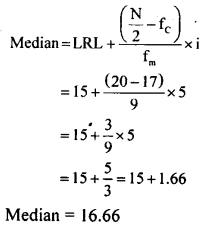
∴ Median class is 15 – 20
LRL = 15
Fc = 17
Fm = 9
i = 5
Question 9.
Find the mode for the following data.
(i) 4,3,1,5,3, 7, 9,6 Answer: Mode = 3
(ii) 22,36,18,22,20,34,22, 42, 46,42
Answer:
Mode = 22
Question 10.
Find the mode for the following data
| X | 5 | 10 | 12 | 15 | 20 | 30 | 40 |
| f | 4 | 8 | 11 | 13 | 16 | 12 | 9 |
Answer:
Mode = 20 (It has the highest frequency)