Students can Download 2nd PUC Statistics Previous Year Question Paper June 2016, Karnataka 2nd PUC Statistics Model Question Papers with Answers helps you to revise the complete Karnataka State Board Syllabus and score more marks in your examinations.
Karnataka 2nd PUC Statistics Previous Year Question Paper June 2016
Time: 3 Hrs 15 Min
Max. Marks: 100
Section-A
1. Answer any TEN of the following questions : (10 × 1 = 10)
Question 1.
What is ‘Longevity’?
Answer:
Life expectancy of new born baby is called ‘longevity’.
Question 2.
Theoretically which is the best average for the construction on index numbers?
Answer:
Geometric mean (G. M).
Question 3.
Which weights are used in the construction of Paasche’s price index number?
Answer:
Current year quantity (q1).
Question 4.
What is ‘Time series’?
Answer:
Chronological arrangement of statistical data according to time is called ‘Time series’.
![]()
Question 5.
Write the relation between mean and variance of Binomial distribution.
Answer:
Mean > Variance i.e., np > npq
Question 6.
If variance of Chi-square distribution is 10, find its mean.
Answer:
Variance = 2n = 10; Mean = n; ∴ n = \(\frac { 10 }{ 2 }\) = 5
Question 7.
Define ‘parameter’ in testing of hypothesis.
Answer:
Statistical constants of the population such as Mean – μ, S.D – σ are called ‘Parameters’.
Question 8.
Define sampling distribution of a Statistic.
Answer:
It is the distribution of the values of a statistic for different samples of same size.
Question 9.
What is an‘Estimator’?
Answer:
The statistic used to esimate the population parameter is an ‘Estimator’.
Question 10.
Which type of variations cannot be detected by Statistical Quality Control (SQC)?
Answer:
‘Chance causes’ of variation.
Question 11.
What is a ‘Saddle point’ in a game?
Answer:
If is the position where maximin-minimax coincide.
Question 12.
What is ‘carrying cost’ in an inventory?
Answer:
It is the cost associated with carrying or holding the goods instock until the goods are sold or used, denoted by ‘C1‘
Section – B
II. Answer any TEN of the following questions: (10 × 2 = 20)
Question 13.
In a village 2400 live births occured in a year. The number of infant deaths was 60. Calculate infant mortality rate.
Answer:
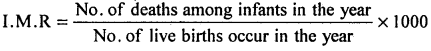
I.M.R = \(\frac { 64 }{ 2400 }\) × 1000 = 25
Question 14.
Write any two considerations for the selection of base year in the construction of an Index number.
Answer:
- It should be economically stable.
- It should not be too long or too short in distance.
Question 15.
If Σp0q0 = 250, Σp1q1 = 310, Σp1q0 = 210, and Σp0q1, = 250, find p01(DB).
Answer:
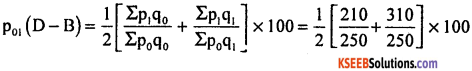
= \(\frac { 1 }{ 2 }\)(0.84+1.24) × 100 = \(\frac { 2.08 }{ 2 }\) × 100 = 104 2 2
Question 16.
Write any two demerits of least square method.
Answer:
- The procedure of calculation is difficult.
- If one of the value is added or removed,’ whole procedure has to be repeated.
![]()
Question 17.
Define ‘Interpolation’ and ‘Extrapolation’.
Answer:
‘Interpolation’ is the technique of estimating the value of dependent variable (y) for any intermediate value of the independent variable (x).
‘Extrapolation’ is the technique of estimating the value of dependent variable (y) for any value of independent variable (x) which is outside the given series.
Question 18.
If q = 0.4 for a Bernoulli distribution, find mean and variance of the distribution.
Answer:
If q = 0.4; ∴ p = 1 – q = 1 – 0.4 = 0.6, Mean = p = 0.6 Variance = pq = 0.6 × 0.4 = 0.24
Question 19.
Under what conditions does the Hypergeomctric distribution tends to Binomial distribution?
Answer:
Hypergeometric when
(i) (a + b) is very large i.e., (a + b) → ∞ and
2.
![]()
Question 20.
A random sample of size 36 is drawn from a population whose standard deviations is 4, Compute standard error of the sample mean.
Answer:
Given: n = 36, σ = 4, S.E(X̄) =\(\frac{\sigma}{\sqrt{n}}=\frac{4}{\sqrt{36}}=\frac{4}{6}\) = 0.67
Question 21.
Define ‘Type-I Error and ‘Type-II Error’.
Answer:
‘Type 1 error’ is taking a wrong decision to reject the null-hypothesis when it is actually true. ‘Type II error’ is taking a wrong decision to accept the null hypothesis when it is actually not true.
Question 22.
Mention any two advantages of ‘Acceptance Sampling Plan’,
Answer:
Advantages of acceptance sampling are:-
- This method is more suitable when the items are of destructive in nature.
- It is less expensive, required few staff as compared to 100 inspection.
Question 23.
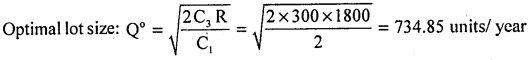
Given R = 1800/year, C3 = 300, C,1 = ₹2/Unit/year, find the optimum lot size of an inventory.
Answer:
Question 24.
Using Maxima-Minimax principle, find the value of the following game.

Answer:

By maximin – minima x principle
- Maximin (∝)-minimum pay-off in each row is circled
- Minimax (β)-maximum pay-off in each column is boxed.
- Saddle point is at (1, 3); ∴ V = 3 is the value of the game.
![]()
Section – C
III. Answer any EIGHT of the following questions : (8 × 5 = 40)
Question 25.
For the following data compute:
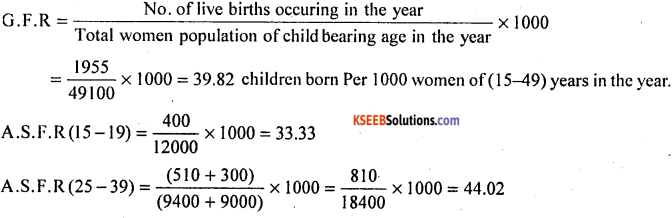
(i) General Fertility Rate
(ii) ASFRs for the age groups 15-19 years and 25-39 years
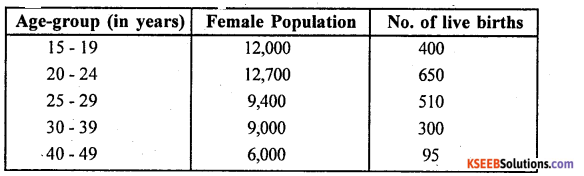
Answer:
Question 26.
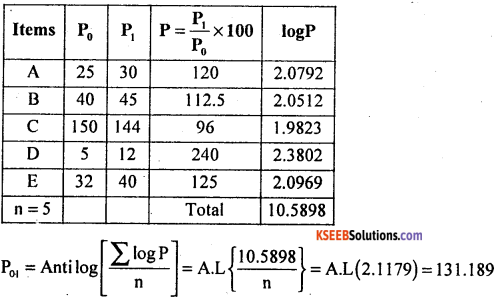
Calculate ‘Simple geometric mean price index number* for the following data:
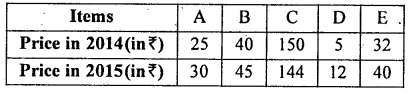
Answer:
Question 27.
Explain the steps involved in the construction of ‘Consumer price index number’.
Answer:
Following are the steps involved in the construction of consumer price index number.
1. Object and scope: The purpose/object is decide for which the index number being constructed as to Farmers, Govt, employes, merchants etc and the scope i.e., geographical area, income group, the time limit for the completion of construction of index number should be decided.
2. Conducting family budget survey: A detailed survey regarding the average expenditure of the families, on various items of consumption, quality/grade of items under the heads of
- Food
- Clothing
- Housing
- Fuel and lights
- Medicine, Education entertainment and
- Miscellaneous are conducted.
3. Obtaining the price quotation: The price list of various items/commodities of current year and base year are obtained from different agencies such as from marketing inspectors, rent control officers, super bazars, Janatha bazars or public distribution system of retail prices are obtained or averaging the prices of various shops in the respective area.
4. Methods of construction: Decision has to be made on the basis of purpose, accuracy need and the availability of data, among
- Aggregative expenditure method
- Family budget method.
Question 28.
Compute five yearly moving averages for the following data :
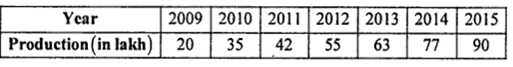
Answer:
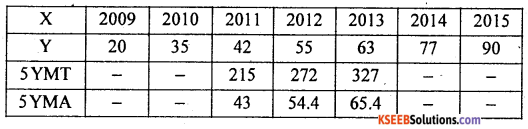
5YMT – 5 yearly moving total 5YMA – 5 yearly moving average.
Question 29.
‘Interpolate’ and ‘Extrapolate’ the sales for the years 2013 and 2016 for the following data:
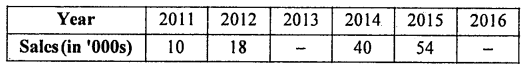
Answer:
Let X and Y be the year and sales 1000’s
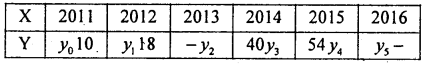
Here the number of known values n = 4
The Binomial expanssion (y – 1)4 = 0
i.e ., y4 – 4y3 + 6y2 – 4y41 + yo=0 ______(1)
and increase the suffixes ofy in equation (1)
We get y5 – 4y4 + 6y3 – 4y2 + y1 = 0 _______(2)
From equation (1) be substuting values ofy’s
We get 54 – 4 (40) + 6y2 – 4(18) +10 = 0
54- 160 + 6y2 – 72 + 10 = 0
∴ 6y2 – 168 = 0
∴ y4 = \(\frac { 168 }{ 6 }\) = 28(000’s)
Similarly from (2) by substituting values We get
y5 – 4(54) + 6(40) – 4(28) + 18 = 0
y5-216 + 240- 112+ 18 = 0
y5 – 70 = 0; ∴ y5 = 70(000’s).
Question 30.
The probability of a thermometer manufactured by a firm found to be defective is 0.02. Find the probability that a box containing 50 thermometers contain no defective ones. Among 100 such boxes, how many contain exactly 2 defective thermometers?
Answer:
Let X be the number of defective thermometers is a Binomial Variate with the parameters n = 50, P = 0.02. Here ‘n’ is large and ‘p’ is very small, under these conditions tends to Poisson distribution with mean λ = np = 50 × 0.02 = 1
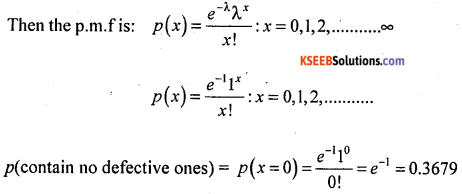
No. of boxes contain exactly 2 defective thermometers = p(x = 2) x N(= 1000)
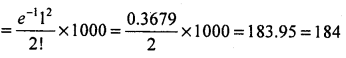
![]()
Question 31.
Mean and variance of normal distribution are 20 and 9 respectively. Find Q,, Q2 and
Answer:
Mean = μ = 20, variance = σ2 = 9. ∴ σ = 3.
Weknow that Q1 = μ – 0.6745 σ = 20 – (0.6745 × 3) = 17.9765 = 18. For a Normal distribution: Q3 = μ + 0.6745 σ = 20. + (0.6745 × 3) = 22.02 = 22
And θ2/ p = Median = mode = 20 = θ2.
Question 32.
From the following data, test whether there is any significant difference in I.Q of boys and I .Q. of girls at a = 5%.
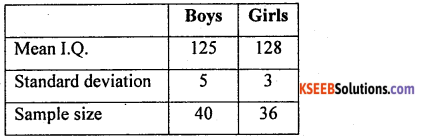
Answer:
Given: n1 =4, n2 = 36, x̄1 = 125, x̄2 = 128, S1 = 5 and S2 = 3
H0: There is no significant difference in I.Q. of boy and girls (i.e., μ1 = μ2)
H1: There is a significant difference in I.Q. of boys and girls (i.e., μ1 ≠ μ2) {Two tailed test}
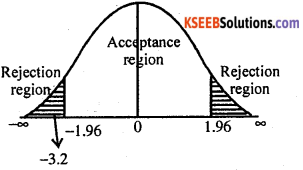
Under H0, the test statistic is:
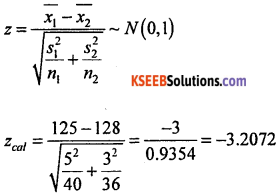
At α = 5% the two tail critical values are ±k = ±1.96
Here zcal lies in rejection region.
∴ H0 is rejected and H1 is accepted.
Conclusion: There is a significant difference in I.Q. of boys and girls (i.e.,μ1 ≠ μ2).
Question 33.
To test the effectiveness of vaccination against Tuberculosis, the following table was obtained.

Test at 1% level of significance whether vaccination and attack of Tuberculosis are independent.
Answer:
χ2 – Test for attributes:
H0: Vaccination and attack of T.B. are independent.
H1 : Vaccination and attack of T.B. are deperdent. {Upper tail test}
The given data can be written in a 2 × 2 – contingency table as below:
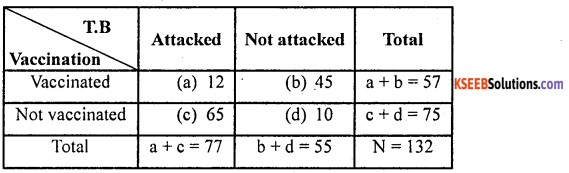
Under H0, the χ2 – test statistic is:
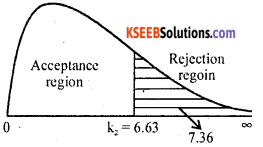
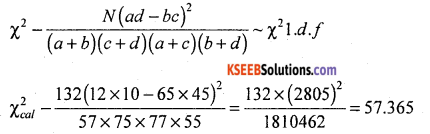
At α = 1% for l.d.f the upper tail critical value k2 = 6.63.
Here χ2cal lies rejection region
∴ H0 is rejected and H1 is accepted.
Conclusion: Vaccination and attack of T.B. are dependent.
Question 34.
Calculate control limits for R-chart for the following data given n = 5.
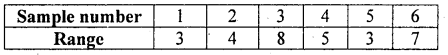
Answer:
Standard not known; the control limits are:-
C.L = R̄ = 5; L.C.L = D3R̄ = 0 × 5 = 0; U.C.L = D4R̄ = 2.115 × 5 = 10.575
Here table constants for n = 5; D3 = 0, D4 = 2.115
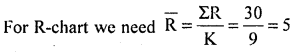
Question 35.
A manufacturer produces 2 products – A and B which needs two machines M1 and M2. Product A requires 10 hours on machine M1 and 4 hours on machine M2. Product B requires 7 hours on machine M1 and 5 hours on machine M2. There are 250 hours of time available on machine M1, and 300 hours on machine M2. Profit earned by the manufacturer on selling one unit of A is ₹ 50 and on selling one unit of B is ₹ 45. Formulate LPP.
Answer:
The given data can be written in the following table as bellow:
From the above table, the L.P.P is:
Maximize Z = 50x + 45y
Subject to constaints, 10x + 7y ≤ 250
4x + 5y < 300 and
Non-negativity restrictions x ≥ 0, y ≥ 0y.
![]()
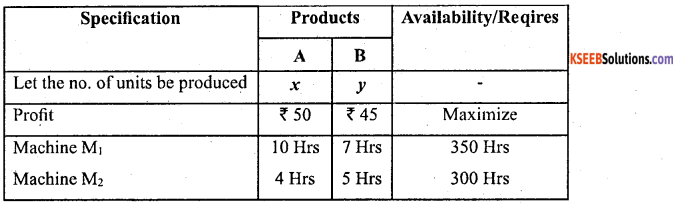
Question 36.
The purchase cost of vehicle is ?50,000 and its resale value is ? 15,000. The maintenance costs in different years are as follows:
Find the optimal replacement period of the vehicle.
Answer:
Given: P = 50,000. Sn = 15,000, Depreiation: (P – Sn) = (50,000 – 15000) = 35000
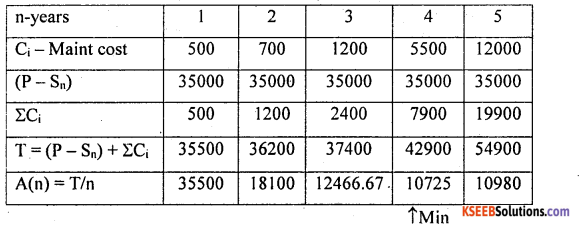
From the above the annual average maintenance cost is minimum for n = 4, is the optimum period for replacement of the vehicle.
Section – D
IV. Answer any two of the following questions: (2 × 10 = 20)
Question 37.
From the following data, compute the standardized death rates for locality A and locality B and comment.
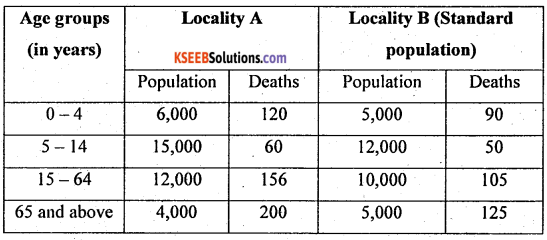
Answer:
Since locality B is taken as standard, so compute CDR for locality B and S.D.R for locality A.
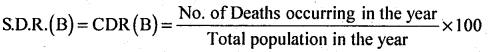
= \(\frac { 370 }{ 32,000 }\) × 1000 = 11.5625 Deaths/1000 population/year of town B

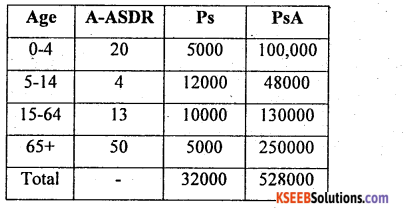
A.S.D.R.(0 – 4) = \(\frac { 120 }{ 6000 }\) x 1000 = 20, similarlly A.S.D.Rs can be calculated for other age groups.
S.D.R (A) = \(\frac { 52,8000 }{ 32,000 }\) = 16.5 Deaths/1000 population/year of town A
Here S.D.R. (B) < S.D.R. (A) so, locality B is more healthier than locality A.
Question 38.
From the following data, compute
(i) Laspeyer’s quantity index number.
(ii) Show that Fisher’s index number satisfies Factor Reversal Test (FRT).
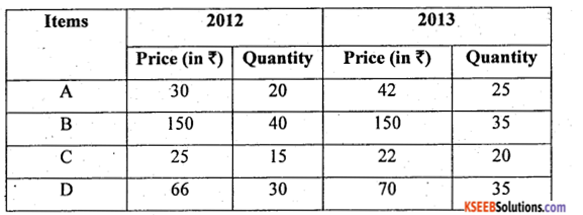
Answer:
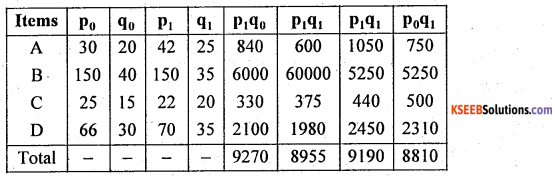
Items 2012 2013
Hence Fisher’s index number satisfies (F.R.T.) Factor reversal Test.
![]()
Question 39.
Fit an equation of the type Y = a + bx for the following data and obtain trend values. Estimate the profit for the year 2016.
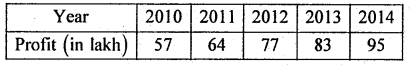
Answer:
Let x and y be the year and profit
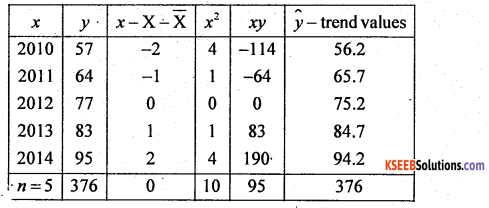
Here X̄ = 2012
From the normal equation: na + b Σx = Ey, Since Σx = 0 a =\(\frac{\Sigma y}{n}=\frac{376}{5}\)=75.2
and from : aΣx + bΣ2 = Σxy ; b = \(\frac{\Sigma x y}{\Sigma x^{2}}=\frac{95}{10}\) = 9.5
The fitted straight line trend equation is:
y = a + bx; ŷ = 75.2 + 9.5x .
Trend values: ŷ(2010) = 75.2 + 9.5(-2) = 56.2
ŷ (2011) = 75.2 + 9.5(-l) = 65.7; ŷ(2012) = 75.2 + 9.5(0) = 75.2
ŷ(2013) = 75.2 + 9.5(1) = 84.7, ŷ(2014) = 75.2 + 9.5(2) = 94.2
Estimation for 2016: ŷ(2016) = 75.2 + 9.5(4) = 75.2 + 36 = ₹ 113.2 lakh profit
Question 40.
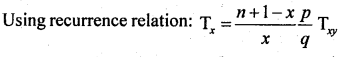
Fit a Binomial distribution for the following data and test at 5% level of significance that binomial distribution is a good fit.
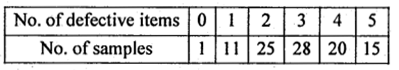
Answer:
Let x be the number of defective items is a Binominal variate with the n = 5, and ‘p’ is obtained as below : let f be the no of samples.
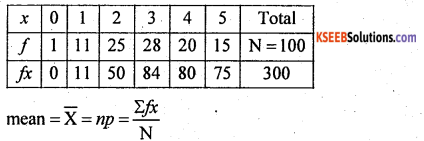
5p =\(\frac { 300 }{ 100 }\) = 3
p = 0.6 and q= 1 – p = 1- 0.6 = 0.4
Then the p.m.f is: p(x) = nCx pxqn – x, x = 0,1, 2-n
p(x) = 5CX (0.6)x (0.4)5 – x, x = 0,1, 2 5
Theoretical frequency / Expected frequency : Tx =p(x) N
T0 = p (x = 0) 100 = 510 (0.6)0 (0.4)5-0 × 100 = 1.024 = 1
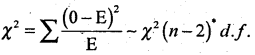
The fitted observed theoretical frequency distribution is:

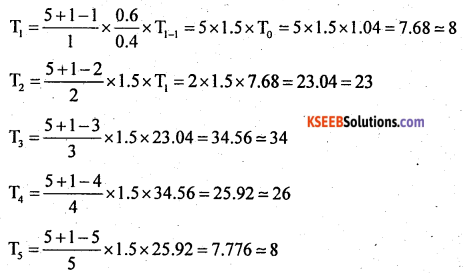
χ2 -TEST: H0: Binomial distribution is good fit (i.e; 0i = Ei)
H1: Binomial distribution is not a good fit (i.e; 0i ≠ Ei ) upper tail test
Under H0, the χ2-test statistic is:-
Here ‘p’ is estimated from the data and of freedom will be (n – 1 – 1) = (n – 2)
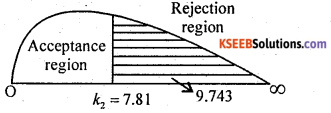
∴ χcal2 = 9.743
At α = 5% for (n – 2) = (5 – 2) =3d.f
The upper tail critical value k2 = 7.31
Here χcal lies in rejection region
∴ H is rejected and H1 is accepted
Conclusion: Binomial distribution is not good fit (0i ≠ Ei).
Section – E
V. Answer any TWO of the following questions: (2 × 5= 10)
Question 41.
Heights of PU students is normally distributed with mean 155cm. and standard deviation 5cm. find the
(i) Probability that a randomly selected PU student has height more than 155cm
(ii) Percentage of PU students having height between 150 cm and 160 cm.
Answer:
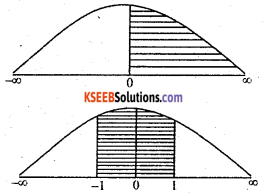
Let be heights is a normal variate with the mean μ = 155 and S.D σ = 5, then the S.N.V
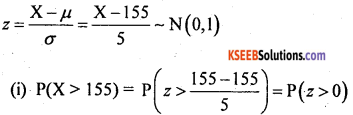
= Area from 0 to ∞ = 0.5
No of Workers = 0.8413 × 5000 = 4206.5
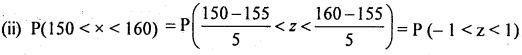
= Area from (-) to ‘1’ = 0.8413 – 0.1587 = 0.6826
The required percentage = 0.6826 × 100 =68.26%
![]()
Question 42.
A machine produced 6 defective articles among 50 articles. Test whether the proportion of defective articles is less than 10% (use a = 5%)
Answer:
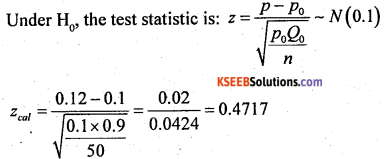
Given: (for test for preportion) x = 6, n = 50
∴ The sample proportion : P = \(\frac{x}{n}=\frac{6}{50}\) = 0.12
Population proportion : P0 =10% = 0.1 and α = 5%
H0: Proportion of defective articles is 10% (i.e. P0 = 0.1)
H1 : Proportion of defective articles is less than 10% (i.e., P0 < 0.1) {Lower tail test}
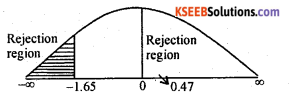
At α = 5% the lower tail critical value -k = – 1.65
Here Zcal lies in rejection region
∴ H0 is accepted.
Conclussion: Proportion of defective articles is 10% (i.e., P0 = 0.1)
Question 43.
Following data gives the readings of sugar level of 5 diabetic patients before and after taking insulin.

Using 1% level of significance, test whether insulin has reduced sugar level in patients.
Answer:
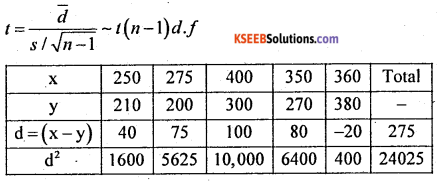
Given: for paired t – test: n = 5, let x and y be the sugar level before and after taking insulin
H0: Mean sugar level is same before and after taking insulin (i.e., µ1 = µ2)
H1 : Mean sugar level is less / reduced after taking insulin (µ1 = µ2) (upper tail test)
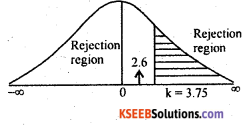
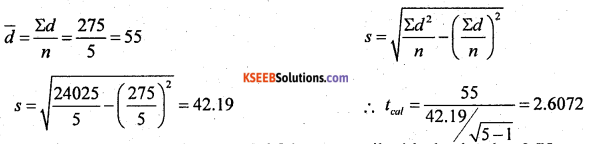
At α = 1% for (n-1) = (5 – 1) = 4 d.f the upper tail critical value k = 3.75 Here tcaI lies in acceptance region
∴ H0 is accepted.
Conclusion: Sugar level is same before and after taking insulin (µ1 = µ2).
Question 44.
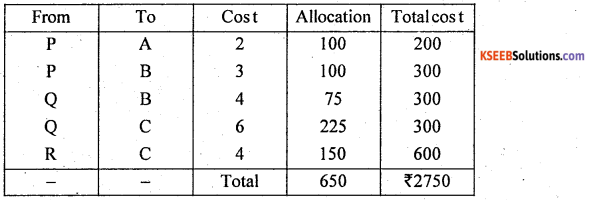
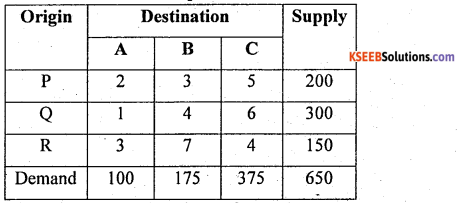
For the following transportation problem, obtain an initial basic feasible solution using North-west Corner rule. Also find transportation cost.
Answer:
Let ai and bj be supply and demanced , then the T.P is :
Here Σai = Σbj = 650 T.P is balanced
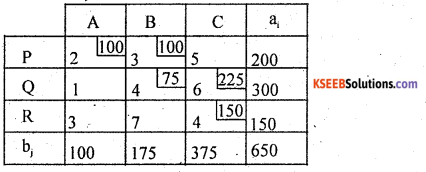
By N.W.C.R first allocation is made at(1, 1) cell as : X11 = min (200, 100) =100
Similarly all allocations can be made
The suggested initial basic peasible solution (I.B. F.S) and total transportation cost is