You can Download Chapter 13 Representation of Geographical Data Questions and Answers, Notes, 2nd PUC Geography Question Bank with Answers Karnataka State Board Solutions help you to revise complete Syllabus and score more marks in your examinations.
Karnataka 2nd PUC Geography Question Bank Chapter 13 Representation of Geographical Data
I. Answer the following in a word or a sentence each:
Question 1.
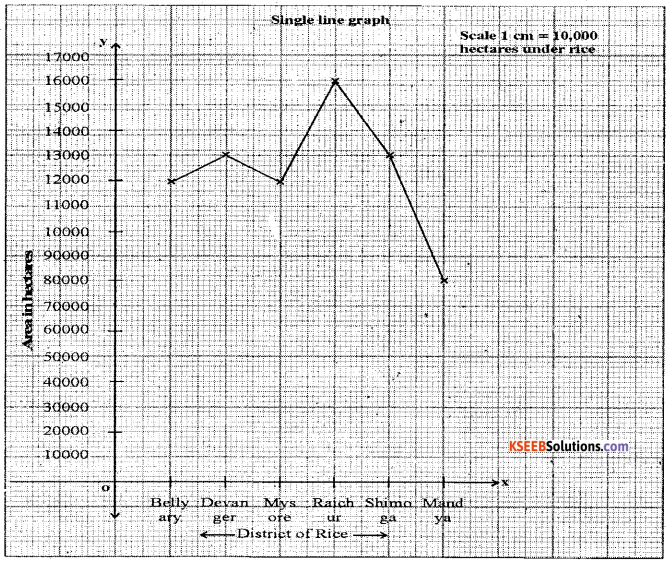
Construct a Line-graph by using the following data Karnataka : Selected district wise Area under rice [in hectares].
| District | Area |
| Bellary | 1,22,721 |
| Davanagere | 1,30,208 |
| Mysore | 1,23,803 |
| Raichur | 1,64,925 |
| Shimoga | 1,31,070 |
| Mandya | 88,657 |
Answer:
![]()
Question 2.
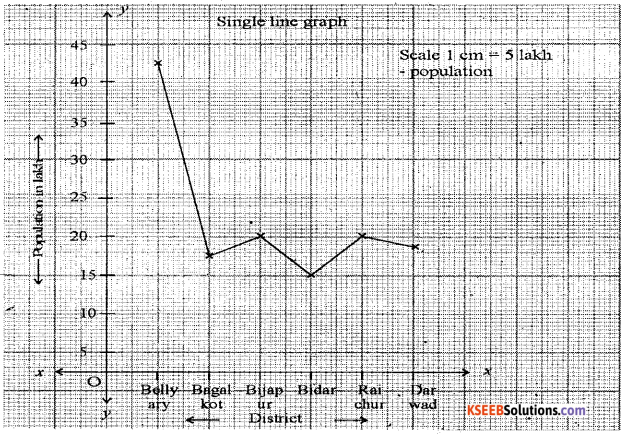
Construct a Line-graph by using the following data Karnataka : Selected district – wise Population [in lakh].
| District | Population |
| Belgaum | 47.8 |
| Bagalkot | 18.9 |
| Bijapur | 21.8 |
| Bidar | 17.0 |
| Raichur | 19.3 |
| Dharwad | 18.5 |
Answer:
Question 3.
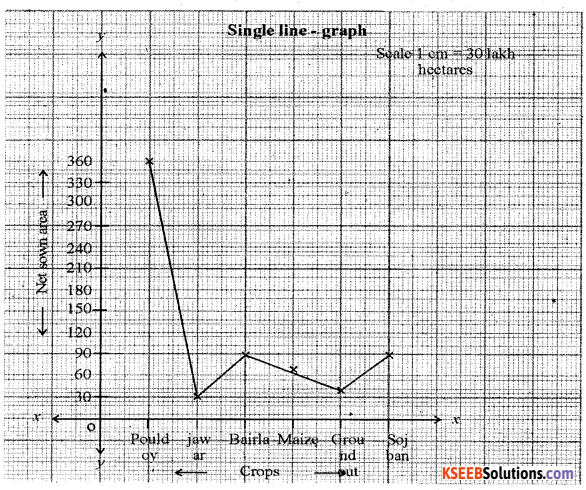
Construct a Line-graph by using the following data India: Net area sown of selected crops [in lakh hectare] 2011.
| Crops | Net sown area |
| Paddy | 358.64 |
| Jowar | 30.55 |
| Bajra | 86.38 |
| Maize | 75.84 |
| Groundnut | 49.84 |
| Soybean | 93.35 |
Answer:
Question 4.
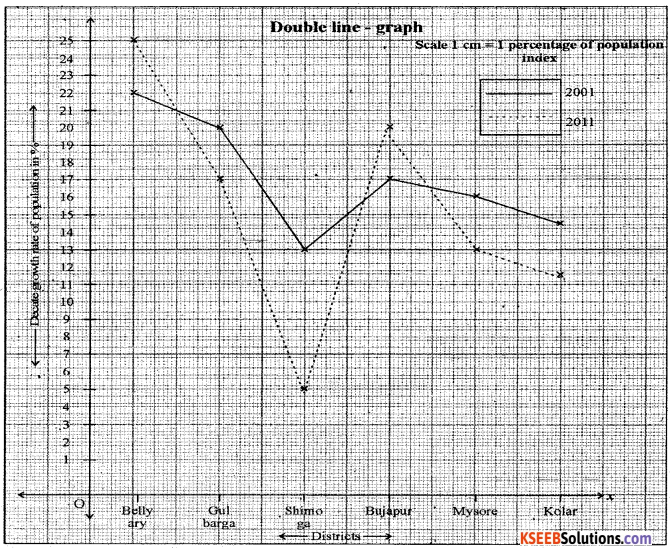
Construct a Double Line graph by using following data Karnataka: Selected district wise decade growth rate of Population [in Percentage].
| District | 2001 | 2011 |
| Bellary | 22.41 | 24.92 |
| Gulbarga | 21.76 | 17.94 |
| Shimoga | 13.10 | 6.88 |
| Bijapur | 17.51 | 20.38 |
| Mysore | 15.75 | 13.39 |
| Kolar | 14.46 | 11.04 |
Answer:
![]()
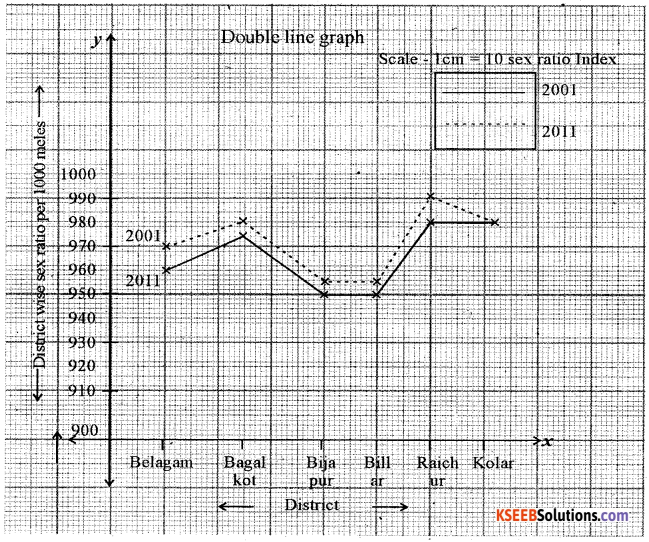
Question 5.
Construct a Double Line graph by using following data Karnataka : Selected district wise sex ratio [Per – 1000 Males].
| District | 2001 | 2011 |
| Belagum | 960 | 969 |
| Bagalkot | 980 | 984 |
| Bijapur | 950 | 954 |
| Bidar | 949 | 952 |
| Raichur | 983 | 992 |
| Koppal | 983 | 983 |
Answer:
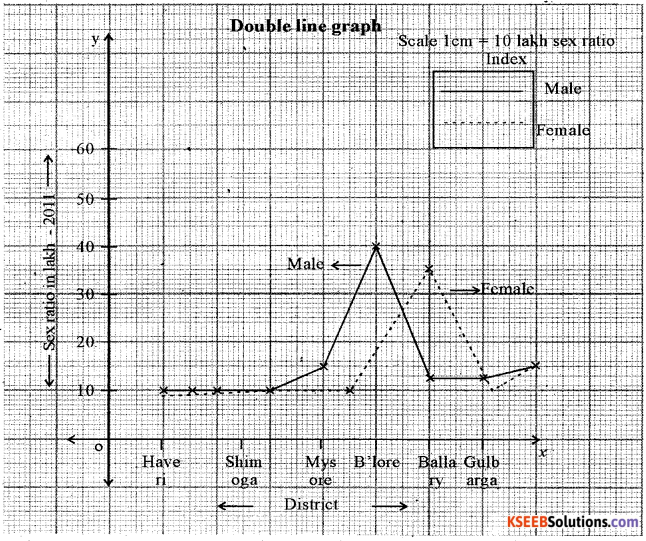
Question 6.
Construct a Double Line graph by using following data Karnataka : Selected district wise sex ratio [in Lakh] -2011.
| District | Male | Female |
| Haveri | 8.2 | 7.8 |
| Shimoga | 8.8 | 8.7 |
| Mysore | 15.1 | 14.9 |
| Bangalore | 50.2 | 46.0 |
| Bellary | 12.4 | 12.2 |
| Gulbarga | 13.0 | 12.6 |
Answer:
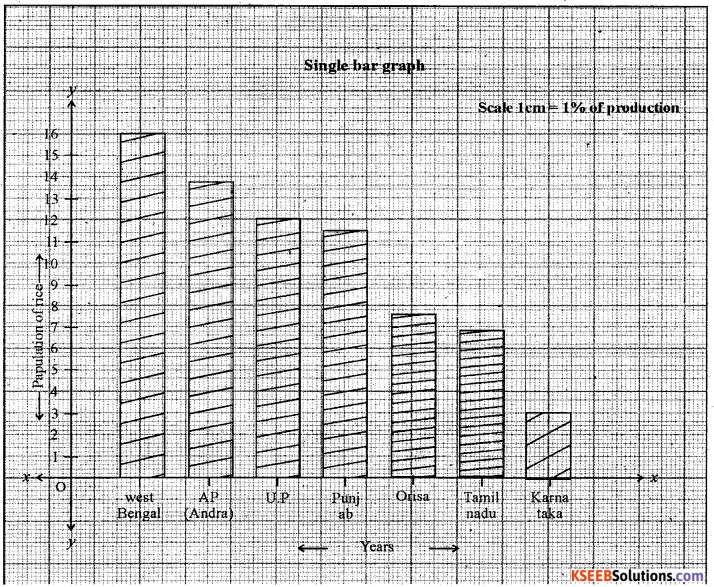
Question 7.
Construct a Single bar graph by using following data India: Selected state wise Rice Production [in Percentage].
| District | Production |
| West bengal | 15.80 |
| Andhra Pradesh | 12.71 |
| Uttar Pradesh | 11.91 |
| Punjab | 10.86 |
| Orissa | 7.31 |
| Tamilnadu | 7.08 |
| Karnataka | 3.70 |
Answer:
![]()
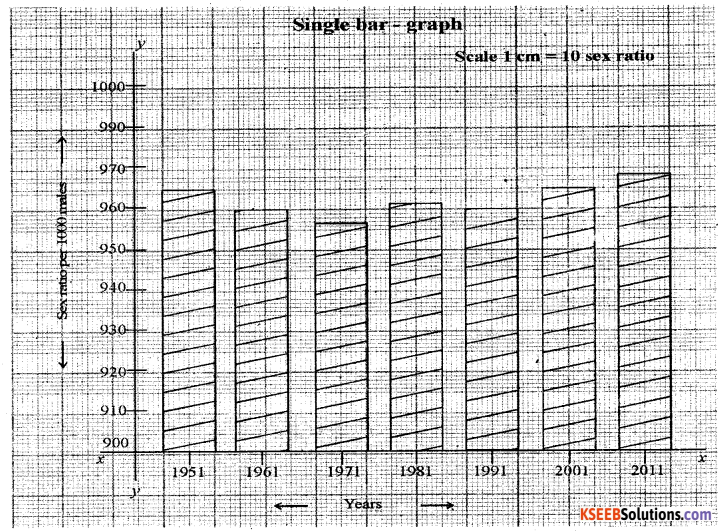
Question 8.
Construct a Single bar graph by using following data Karnataka : Decade wise sex ratio [Per 1000 males].
| Year | Female |
| 1951 | 966 |
| 1961 | 959 |
| 1971 | 957 |
| 1981 | 963 |
| 1991 | 960 |
| 2001 | 965 |
| 2011 | 968 |
Answer:
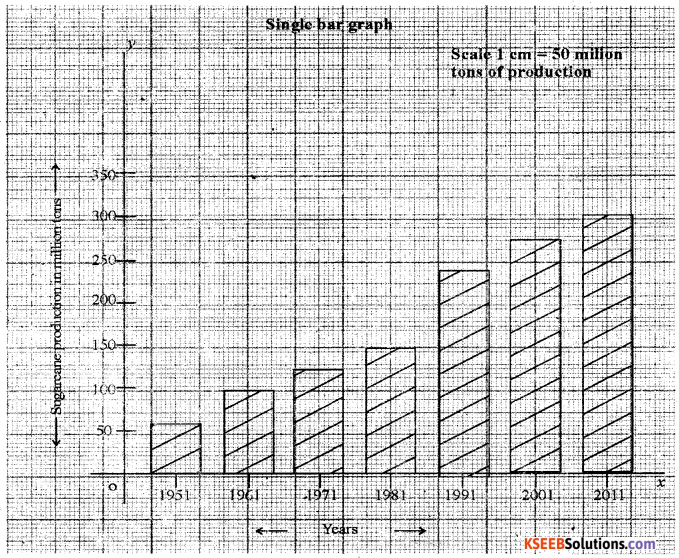
Question 9.
Construct a Single bar graph by using following data India: Decade wise sugarcane production [in million tons].
| Year | Production |
| 1951 | 57.05 |
| 1961 | 110.0 |
| 1971 | 126.36 |
| 1981 | 156.24 |
| 1991 | 241.04 |
| 2001 | 286.00 |
| 2011 | 310.0 |
Answer:
Question 10.
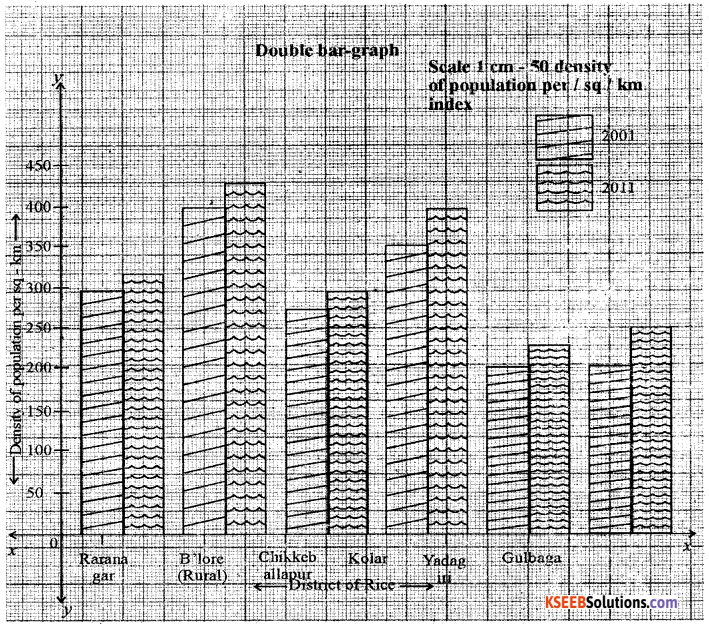
Construct a double bar graph by using the following data Karnataka: Selected district wise density of population [Per sq.km.
| District | 2001 | 2011 |
| Ramnagar | 288 | 303 |
| Bangalore [Rural] | 380 | 441 |
| Chikkaballapur | 273 | 298 |
| Kolar | 346 | 384 |
| Yadagir | 183 | 224 |
| Gulbarga | 198 | 233 |
Answer:
![]()
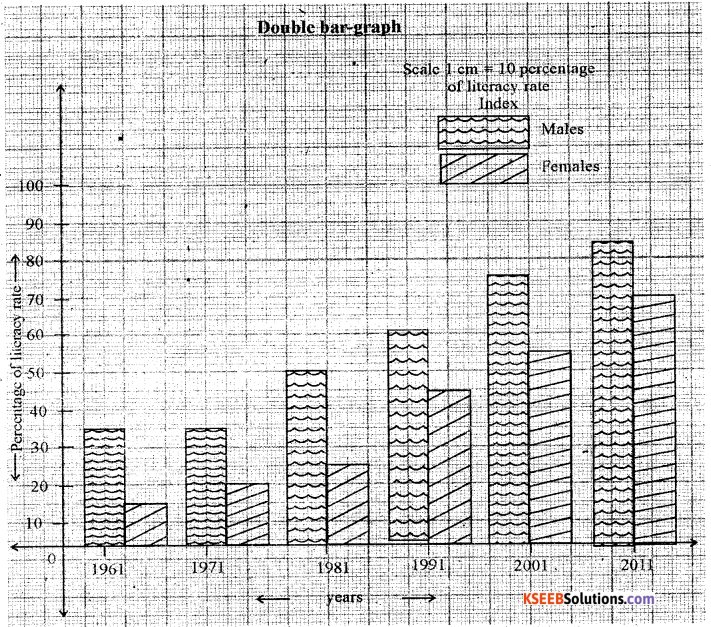
Question 11.
Construct a double bar graph by using the following data Karnataka: Literacy rate [in percentage] – 2011.
| Year | Male | Female |
| 1961 | 36.2 | 14.2 |
| 1971 | 41.6 | 21.0 |
| 1981 | 48.8 | 27.7 |
| 1991 | 67.3 | 44.3 |
| 2001 | 76.1 | 56.9 |
| 2011 | 82.9 | 68.1 |
Answer:
Question 12.
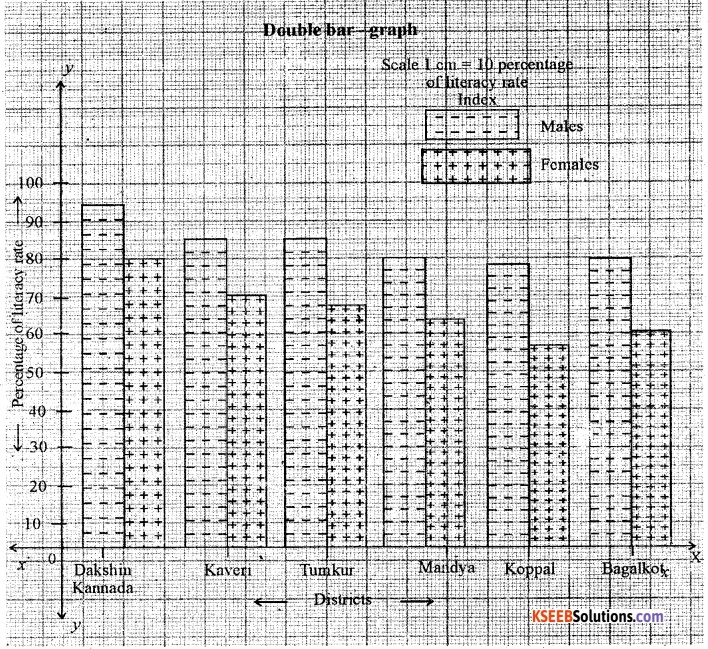
Construct a double bar graph by using the following data Karnataka: Selected district wise literacy rate [in percentage] – 2011.
| District | Male | Female |
| Dakshina Kannada | 93.31 | 84.80 |
| Haveri | 83.89 | 70.65 |
| Tumkur | 82.05 | 66.45 |
| Mandya | 78.14 | 62.10 |
| Koppal | 78.21 | 56.22 |
| Bagalkot | 80.16 | 58.55 |
Answer:
Question 13.
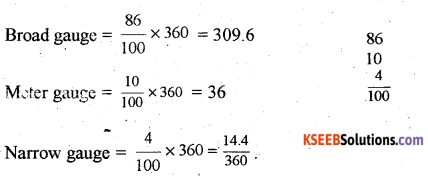
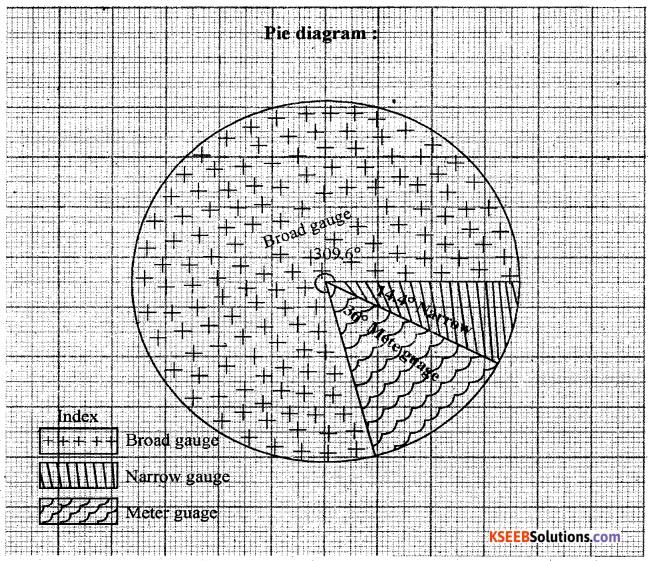
Construct a Pie Diagram using the following data India: Types of Railway gauges – 2012.
| Types | Percentage |
| Broad gauge | 86 |
| Meter gauge | 10 |
| Narrow gauge | 4 |
Answer:
![]()
Question 14.
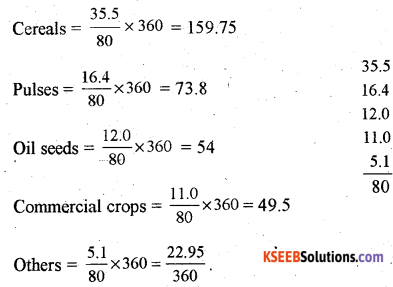
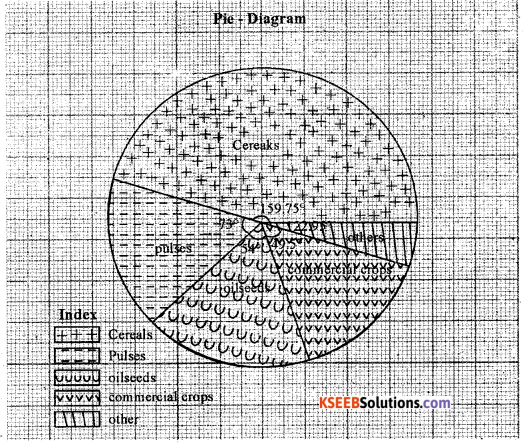
Construct a Pie – Diagram using the following data India: Area under selected Kharif crops [in lakh hectare].
| Crops | Area |
| Cereals | 35.5 |
| Pulses | 16.4 |
| Oilseeds | 12.0 |
| Commercial crops | 11.0 |
| Others | 5.1 |
Answer:
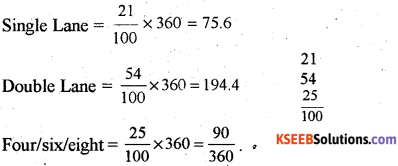
Question 15.
Construct a Pie-diagram using the following data India: The percentages of N.H in terms of width -2011.
| Types | Percentage |
| Single Lane | 21 |
| Double Lane | 54 |
| Four/six/eight | 25 |
Answer:
Question 16.
Explain the Primary sources of data?
Answer:
Meaning – The data which are collected for the first time by a researcher or groups of researchers, institution or organizations are called Primary sources of data.
Types of Primary data collection:-
1. Through Personal interview : Personal interviews are the most commonly used method of collecting data, because the interviewer has the opportunity of explaining the study and answering any question, here the researcher gets direct information from the respondents.
2. By Personal observations: It refers to the collection of data or information by individuals or group of individuals, through direct observations in the field.
3. By Questionnaire : The most common method used in surverys is the Questionnaire. In this method, simple questions and their possible answers are written on a plain paper, and the respondents have to tick mark the possible answers from given choices.
4. Others methods :
- Telephone interview: In this method, the researcher/interviewer can collect the information over the telephone.
- Measuring properties: In this method, the data about properties of soil, and water collected directly from the field by measuring their characteristics using soil and water quality kit.
Question 17.
Explain the Secondary sources of data?
Answer:
Meaning – The data those have been collected and analyzed already by some departments, organizations, NGO’s etc are called Secondary data.
Types of Secondary sources of data
1. Published sources – There are 5 types
- International publications: In this publications-year books, monographs and reports are published by different agencies of the united nations.
- Government publication: These publications comprise the census of India published by office of the register general of India.
- Semi Government publication: In this category the publications and reports of corporations, boards, urban development authorities etc.
- Private publication : The research reports, surveys, year-books and monographs are published.
- Newspapers and Periodicals : The daily news papers and periodicals or magazines are easily accessible.
2. Unpublished sources – There are 3 types.
- Government Documents : The reports, papers, findings, monographs and documents are prepared a$d maintained as unpublished records at different levels of Government.
- Government Records : The corporations, boards, district councils and civil departments prepare and maintain the periodical reports and the development plans.
- Private Documents : The companies, trade unions, different political and non-political organizations and resident welfare associations are having unpublished reports and records.
![]()
Question 18.
Distinguish between Primary and Secondary data?
Answer:
| Primary | Secondary |
| (a) The data which are collected for the first time by a researcher or group of researchers, institutions or organizations are called Primary data. | (a) The data those have been collected and analyzed already by some departments, NGO’s etc …. are called Secondary data. |
| (b) These are original in character and first hand information. | (b) Here instead collecting the data by primary method the researcher may take, the help of Secondary data. |
Question 19.
Explain the components of GIS. Ans: The components of GIS are
Answer:
1. Data : Geographical data can be divided into 3
- Spatial data Any data which is associated with a specific geographical location, eg Locating of India, Bangalore city, KRS dam.
- Attribute/Non-spatial data Any data which is not associated with a specific geographical location.
- Continous dataThe data which have no discrete boundaries like soil, atmospheric temperature and land elevation.
2. Software : There are the programmes designed to run the computer. However, GIS is designed to collect, store, process geographical data and construct maps.
3. Hardware : Hardware comprises storing and processing devices like central process unit, monito, key board, mouse, printer, scanner etc…
4. People : This component consists of the skilled people who involve in data capturing, processing and analyzing.
5. Analysis : It involves the processing of GIS data with various analyses so as to get meaningful information.
Question 20.
Explain the functions of GIS.
Answer:
- Capture data : Geographical data can be collected/captured from various sources like hard copy, map through tophosheet, digital data, through GPS, Secondary data through published tables.
- Storing data : Geographical data once captured, it needs to transform from Analogy into digital format and to be stored in computer for further analysis.
- Query : Once you have a functional GIS containing your geographical information, you can begin to ask a simple questions.
- Analysis : There are 3 types
- Proximity Analysis : Proximity queries find features with in a certain distance of other features.
- Overlay Analysis : It is simplest, this could be a visual operation, but analytical operations require One or more data layers to be joined physically.
- Network Analysis : Anetwork is a set of edges and junctions that are Topologically connected to each other.
- Display : Once analysis is done maps, diagrams, graphs and tables are to be designed and same has to be displayed over computer moniter.
- Output: This is final, stage of GIS function where in the maps, data tables etc…. can be printed to have hard copy as output.
Question 21.
Explain the segments of GPS.
Answer:
There are three segments of GPS:-
1. The space segments : The satellites of GPS are launched and positioned at an altitude of approximately 20200 km which is almost more than three times of the earth’s radius. The space segment consists of a constellation of 24 functioning GPs satellites located in 6 orbital plane with 4 satellites in each orbital plane. The time for the satellite to complete one revolution around the earth is 11 hrs and 58 minutes.
2. The control segment: The control segment consists of facilities necessary for satellites especially healthy monitoring, telemetry, tracking command and control clock error ‘ computation .of satellites. There are 5 GPS stations spread over the earths surface they are
- Hawaii
- Colorado spring
- Ascension Island
- Diego Garcia
- Kwajalein.
3. The user segment: It is a total user and supplier community, both civilian and military. The user segment consists of all earth – based GPS receivers. Receivers very greatly in size and complexity, through the basic design in rather simple. The space and control segments are largely transparent to the operations of navigation functions.
![]()
Question 22.
Explain the applications of GPS.
Answer:
- Navigation : In navigation, by using GPS can save countless hours in the field. Any feature, even if it is under water, can be located upto one hundred meters simply by scaling coordinates from a map, entering way points & going directly to site.
- Remote sensing and GIS : GPS positioning can be intergrated into remote – sensing methods such, as Photogrammetry and aerial scanning, magnetometry, and video technology using DGPs techniques.
- Surveying/Mapping : The high precision of GPS’ carries phase measurements, together with appropriate adjustment algorithum, provides an adequate tool for a variety of tasks for surveying and mapping. .
- Geodesey : Geodetic mapping and other control surveys can be carried out effectively using high grade GPs equipment.
- Military : The GPs was Primarily develped for real time military positioning. Military applications include airbone, marine and land navigation.
Question 23.
Explain the elements of remote sensing?
Answer:
- Energy source of Illumination (A) – The first requirement for remote sensing is to have an energy source which illuminates or provides electromagnetic energy to acquire information of the earth’s surface.
- Radiation and the Atmosphere (B) – As the energy travels from its source to the target, it will come in contact with and interact with the atmosphere it passes through.
- Interaction with the Target (C) – Once the energy makes its way to the target through the atmosphere.
- Recording of energy by the sensor (D) – After the energy has been scattered by, or emitted from the target we require a sensor to collect and record the electromagnetic radation.
- Transmission, Reception and Processing (E) – The energy recorded by the sensor has to be transmitted, often in electronic form, to a receiving and processing station where the data are processed into an image.
- Interpretation and Analysis ’(F) – The processed image is interpreted, visually/or digitally or electronically, to extract information about the target which was illuminated.
- Application (G) – The final elements of the remote sensing process is acheived when we apply the information to better understand it and solve a particular problem.
Question 24.
Write the importance of remote sensing?
Answer:
Remote sensing is the science and art of obtaining information about an object, area or phenomenon through the analysis of data aquired by a device that is not in contact with it. This is done by sensing and recording reflected or emitted energy and processing, analyzing and applying that information.
In much remote sensing, the process involves an interaction between incident radiation and the targets of interest. This device can be a camera or a bank of sensors operated from an airplane or a satellite. Though satellite we can collect date related agriculture, forest, urban land use, water, natural calamities etc the satellite data is based for mapping, monitoring, studying the various phenomena related to earth’s surface.
![]()