Students can Download 1st PUC Statistics Model Question Paper 2 with Answers, Karnataka 1st PUC Statistics Model Question Papers with Answers helps you to revise the complete Karnataka State Board Syllabus and score more marks in your examinations.
Karnataka 1st PUC Statistics Model Question Paper 2 with Answers
Time: 3 Hrs 15 Min
Max. Marks: 100
Note:
- Graph sheets and statistical tables will be supplied on request.
- Scientific calculators may be used.
- All working steps should be clearly shown.
Section – A
I. Answer any TEN of the following questions. (10 × 1 = 10)
Question 1.
Define nominal scale in statistics.
Answer:
Number assigned for every unit for identification of different categories is called nominal scale.
Question 2.
What is primary data?
Answer:
Primaiy data are those which are collected by the investigator himself for the first time for his own purpose.
Question 3.
Write the formula of Struge’s rule to find the number of classes.
Answer:
Number of classes (K) = 1 + 3.22 10g N. ; N – Number of observations.
Question 4.
Define class interval.
Answer:
In a frequency distribution if the range is divided into subranges are called class interval.
Question 5.
What is an ‘ogive’?
Answer:
The cumulative frequency curve is called ‘ogive’.
![]()
Question 6.
What is a ‘open-end class’ in a frequency distribution?
Answer:
If in a class, the lower or upper limits are not specified are called open classes.
Question 7.
In a shoe shop, the highest sales of shoe size is 8. What would you conclude?
Answer:
Modal(z) size is 8.
Question 8.
If variance = 4 cm2. Find the standard deviation.
Answer:
Standard deviation = σ = \(\sqrt{\text { variance }}\) = \(\sqrt{4}\)
σ = 2 cm.
Question 9.
What are the limits of correlation co-efficient?
Answer:
γ = ± 1 or -1 ≤ γ≤ 1
Question 10.
Mention one assumption of interpolation and intrapolation?
Answer:
There are no sudden fluctuations in values of the data.
Question 11.
Find P(A’)
Answer:
P(A’) = 1 – P(A).
Question 12.
What is mean of a random variable?
Answer:
Mean of a random variable : E(x) = Σx.P(x)
Section – B
II. Answer any TEN of the following questions. (10 × 2 = 20)
Question 13.
Write any two functions of statistics.
Answer:
- It simplifies the complexity of the data.
- It reduces the bulk of the data.
Question 14.
Mention whether the following statements are discrete or continuous variables.
(a) The temperature of a patient,
(b) Ages of employees.
Answer:
(a) discrete variable
(b) continuous variable.
Question 15.
What is Qualitative classification of data? Give an example.
Answer:
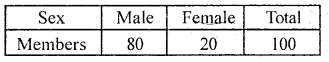
Qualitative classification: Classification of the different units on the basis of qualitative characteristics (Called Attributes). Such as sex, literacy, employment etc.
e.g., the members of a club can be classified on the basis of sex wise distribution as follows:
Table showing the sex distribution of members of a club
Question 16.
Write down two objects of tabulation.
Answer:
Tabulation
- Simplifies complex data.
- Facilitates comparison.
Question 17.
Which type of bar diagrams are used under the following circumstances?
(a) When two or more different comparable sets of values.
(b) When a comparison of two or more components as percentages.
Answer:
(a) Multiple bar diagram
(b) percentage bar diagram.
![]()
Question 18.
Write two limitations of diagrams and graphs.
Answer:
- They cannot be used for further statistical analysis.
- They can be easily misled and can create wrong impression about the data.
Question 19.
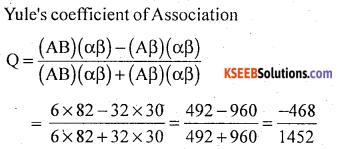
Find the mode of the following distribution.
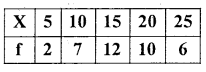
Answer:
Mode (Z) = size of highest frequency.
Highest frequency is 12, its size (x) is 15.
∴ Mode(Z)= 15.
Question 20.
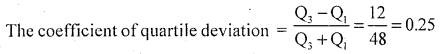
If the sum and difference of upper and lower quartilcs are 48 and 12 respectively, find the coefficient of quartile deviation.
Answer:
Given Q3 + Q1 = 48
Q3 – Q1 =12
Question 21.
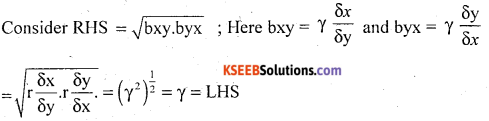
Prove that γ = ±\(\sqrt{\mathrm{bxy} \cdot \mathrm{byx}}\)
Answer:
Question 22.
Write two properties of regression coefficients.
Answer:
- Regression coefficients are independent of the origin but dependent on the scale.
- The geometric mean of two regression co-efficients is numerically equal to the coefficient of correlation.
i.e. γ = ±\(\sqrt{\mathrm{bxy} . \mathrm{byx}}\)
Question 23.
What is the difference between coefficient correlation and association of attributes?
Answer:
Coefficient of correlation measure the degree of relation between variables, where associates of attributes measures the degree of relationship between attributes such as sex and literacy. Success in examination and marriage.
Question 24.
If P(A) = \(\frac { 1 }{ 2 }\), P(B) = \(\frac { 1 }{ 3 }\), P(AnB) = \(\frac { 1 }{ 6 }\), are A and B independent?
Answer:
If A and B are independent, then P(A∩B)= P(A).P(B)
Here \(\frac { 1 }{ 6 }\) = \(\frac { 1 }{ 2 }\) × \(\frac { 1 }{ 3 }\) = \(\frac { 1 }{ 6 }\)
Yes, A and B are independent.
Section – C
III. Answer any SIX of the following questions. (6 × 5 = 30)
Question 25.
What are the important methods of collection of primary data? Explain schedules sent through enumerator method.
Answer:
The different methods of collection of primary data.
- Direct personal interview/observation.
- Indirect oral interview.
- Information through agencies.
- Mailed questionnaire.
- Schedules sent through enumerator.
Schedules sent through enumerator: In this method, a trained enumerator meets informants and collects the necessary information. Here schedule is a list of questions where the answers for the questions will be supplied by the informants and recorded by the enumerator.
Question 26.
Explain briefly two methods of sampling.
Answer:
1. Simple random sampling: In this method the samples are drawn in such a way that every unit of the population has equal chance of being included in the sample. Random samples can be obtained by
- Lottery method
- Use of Random numbers.
2. Stratified sampling: In this method the population is divided in to different groups of units called strata, which are homogeneous with respect to a specific character. From each stratum appropriate number of units are randomly selected. This method is called Stratified sampling.
![]()
Question 27.
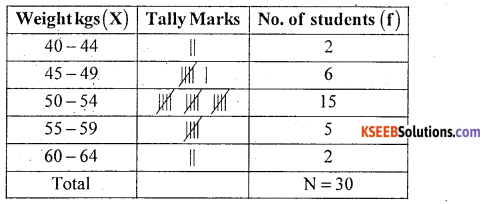
The following are the weights of 30 students. Draw up a frequency distribution with
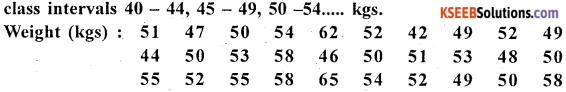
Answer:
Frequency Distribution of weight of students (in kgs)
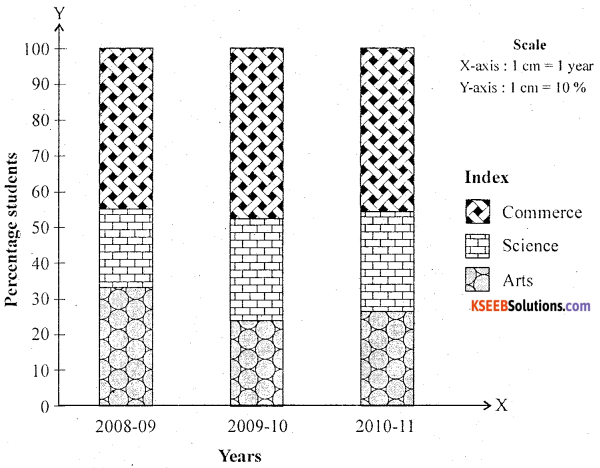
Question 28.
Following is the data regarding strength of students of a college for the 2008-11 academic years.
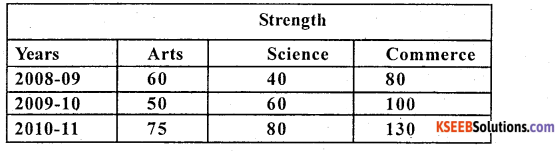
Draw percentage bar diagram.
Answer:
Percentage bar diagram represents the faculty wise distribution of students.
![]()
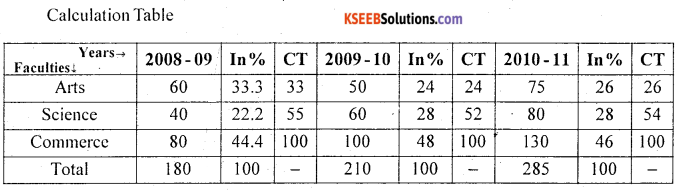
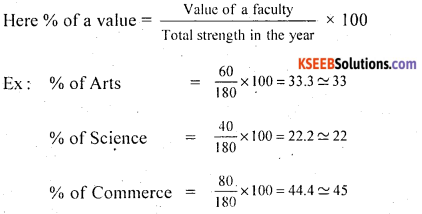
Question 29.
Find the missing frequency in the following frequency distribution if x̄ = 129
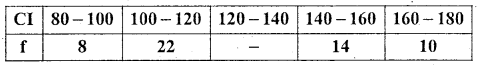
Answer:
Let the missing frequency be k
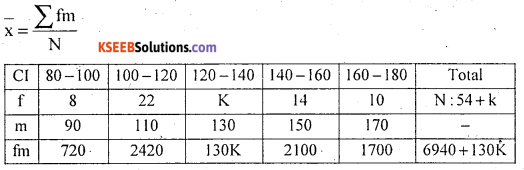
129(54 + K) = 6940 + 130K
6966 + 129K = 6940 + 130K
130K – 129K = 6966 – 6940
K = 26 is the missing frequency.
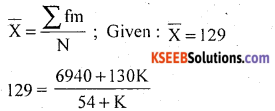
Question 30.
Show the graphical method of measurement of correlation for the following bivariate data.
Answer:
Scatter diagram to show the correlation between the variables X and Y
From the diagram, the spread of points show downward direction. With thick pattern around a straight line. Therefore, there exists high degree negative correlation between the variables X and Y.
Question 31.
Following are the marks obtained by eight students in two subjects as given below.
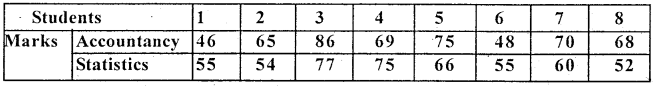
Calculate the Spearman’s rank correlation coefficient.
Answer:
Non-repeated ranks, so use the formula
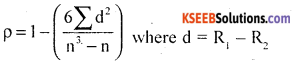
R1; R2 be the ranks of Accountancy and Statistics.
Assign ranks highest marks students as 1, and next descending marks as 2 and so on.
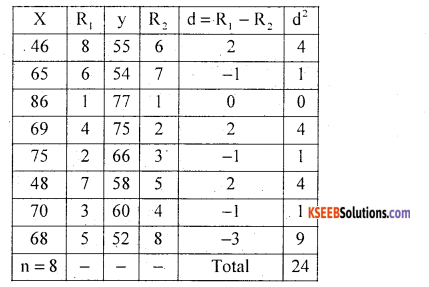
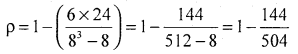
= 1 – 0.2857 = 0.7143
There exists a high degree positive correlation between marks in Accountancy and Statistics.
![]()
Question 32.
Prepare a 2 × 2 contingency table from the following data. Also calculate Yule’s coefficient of association and interpret the result.
N = 150, (α) = 112, (B) = 36 and (AB) = 6
Answer:
The given data can be presented in the 2 × 2 contingency table as below.
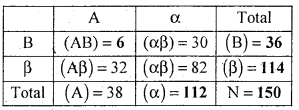
∴ = -0.3223.
There exists low degree negative association.
Question 33.
Using suitable formula for interpolation, estimate the value of y for x.
Answer:

Since the known values of y are 5.
Hence the fifth leading difference will be zero.
i.e. Δ05 = (y – 1)5 = 0 , using Binomial expansion.
we get y5 – 5y4 +10y3 – 10y2 + 5y1 – y0 = 0
∴ 27 – 5(26) + 10(24) – 10y2 + 5(21) – 18 = 0
224 – 10y2 = 0
-10y2 = 224
y2 = 22.4
Question 34.
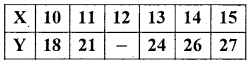
State and prove addition theorem of probability for two non-mutually inclusive events.
Answer:
Statement: Let A and B be two events with respective probabilities P(A) and P(B). Then the probability of occurrence of at least one of these two events is
P(A∪B) = P(A) + P(B) – P(A∩B)
Proof: A random experiment results ‘n’ exhaustive events, ‘m1 ‘ and’m2‘ events are favourable to events A and B respectively. And ‘P’ out comes are common to A × B.
The probabilities are
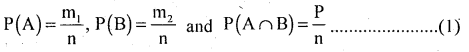
Event (A∪B) i.e. occurrence of at least one of the events is (m1 + m2 – D) favourable events.
P(A∪B)= P( A) + P(B) – P(A∩B): from result (1).
Hence the proof.
![]()
Question 35.
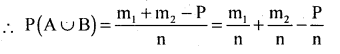
A bag has 4 red, 3 green and 3 yellow marbles. Three marbles are randomly drawn from the bag. What is the probability that they are of
(i) the same colour
(ii) different colours?
Answer:
n = 3 marbles from 10 can be drawn in 10C3 =120 ways.
(i) m = 3 marbles of same colour out of 4 red OR 3 green or 3 yellow can be drawn in 4C3 OR 3C3 OR 3C3 ways.
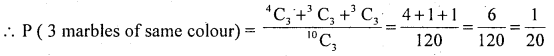
(ii) m = 3 marbles of different colours can be drawn from 4 red, 3 green and 3 yellow marbles in 4C1 × 3C1 × 3C1 ways.
Question 36.
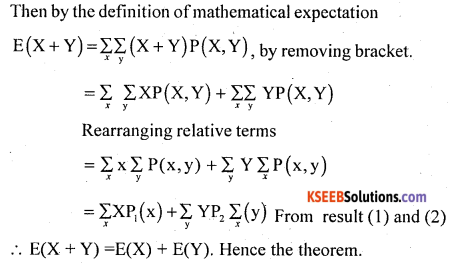
State and prove Addition theorem of mathematical expectation of two events, random variables X and y.
Answer:
Statement: Let X and Y be two random variables with respective expectations E(X) and E(Y). Then expectation of sum of these random variables is
E (X + Y) = E(X) + E(Y)
Proof: Let X and Y be two discrete random variables with their joint/bivariate probability distribution P(x, y) = P[x = x, y = y] and,
The probability distribution ofX and Y are
![]()
Section – D
IV. Answer any TWO of the following questions. (2 × 10 = 20)
Question 37.
In a school the intelligent students are admitted to Batch A and others to Batch B. The students in two batches are aged as follows :
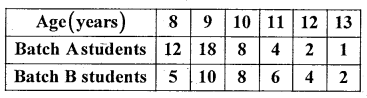
Compare their mean age and variability in age of the students.
Answer:
The data is discrete so use
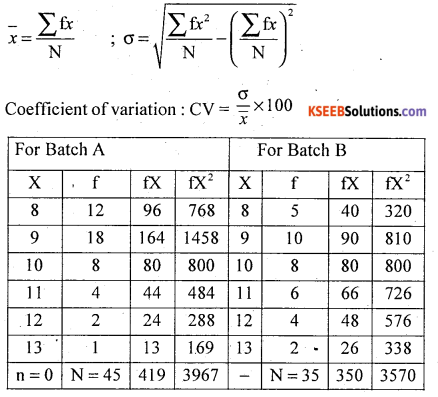
On an average Batch B students more aged than Batch A students.
C.V (A) = 12.968% < C.V (B) = 14.142%
Batch A students ages is less variable than Batch B students.
![]()
Question 38.
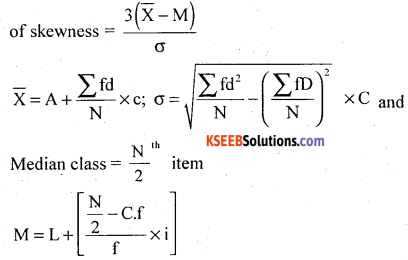
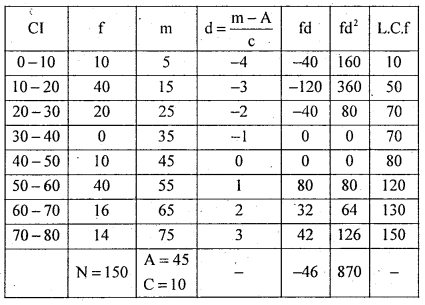
Find Karl Pearson’s coefficient of skewness for the following data.
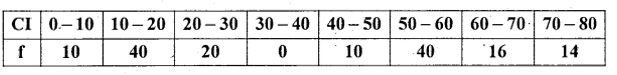
Answer:
In the frequency distribution, frequencies not symmetrical i.e. one of the frequency in the middle class interval is zero. So use the skewness coefficient. Using Karl Pearson’s coefficient
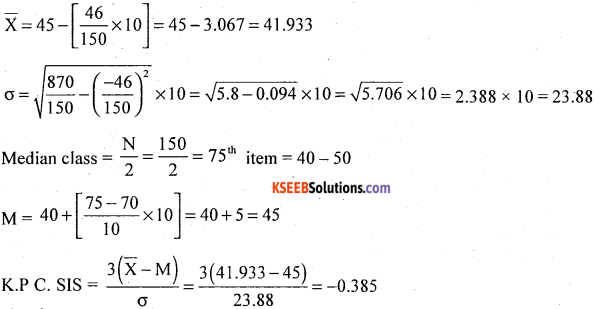
The distribution is negatively skewed.
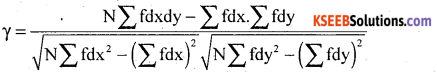
Question 39.
The following table gives ages of employees and income. Calculate the coefficient of correlation.
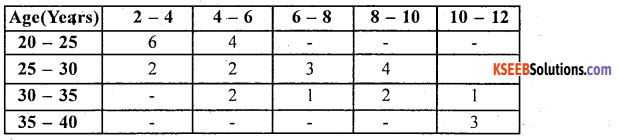
Answer:
Karl Pearson’s coefficient of correlation
![]()
Let X and Y be the Age and Income of employers
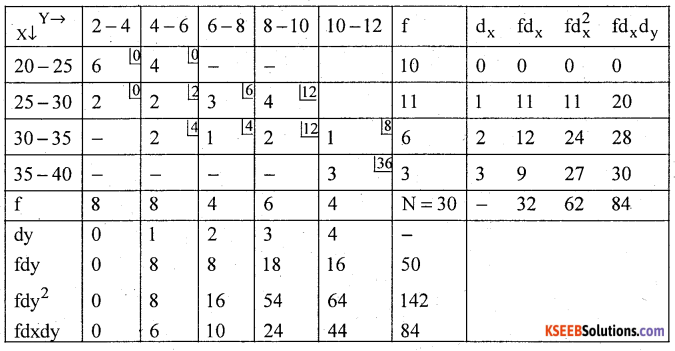
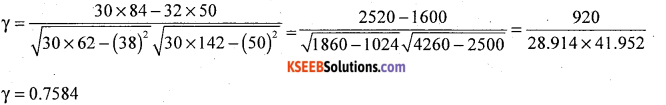
There exists a high degree positive correlation between ages of employees and their income.
![]()
Question 40.
(a) The probabilities of two students A and B solving a problem are \(\frac { 2 }{ 5 }\) and \(\frac { 4 }{ 5 }\). Find the probability that if both try to solve the problem independently, it is solved.
Answer:
Let P(A) = probability that A can solve = \(\frac { 2 }{ 5 }\)
P(B) = probability that B can solve = \(\frac { 4 }{ 7 }\)
P (The problem will be solved) = P (at least one of them will solve)
= P(A∪B) = P(A) + P(B) – P(A∩B)
Since A and B are independent ; = P(A∩B) = P(A). P(B)
= P(A) + P(B) – P(A)P(B)
= \(\frac { 2 }{ 5 }\) + \(\frac { 4 }{ 7 }\) – \(\frac { 2 }{ 5 }\) × \(\frac { 4 }{ 7 }\)
P(A∪B) = 0.7429
(b) For the following probability distribution, find the missing probability and mean.
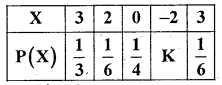
Answer:
We know that from the definition of probability mass function
The probability distribution is
Section – E
V. Answer any TWO of the following questions. (2 × 5 = 10)
Question 41.
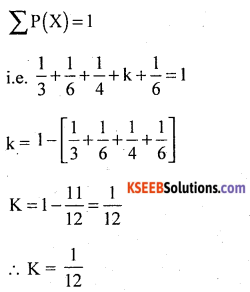
In a survey regarding men smoking habit and visiting hospital due to some ailment in the college, the following information was observed.
Out of 30 office staff 50% were smokers and 25% out of 48 Teaching staff were smokers. 25% among smokers and 8% among non-smokers visited hospitals in the year. Tabulate the above information.
Answer:
Table showing the smoking workers visiting hospital among teachers and office staff.
Foot Note :
VH – Visited Hospital
NVH – Not Visited Hospital
T – Total
Source: Imaginary values given and remaining all computed values.
![]()
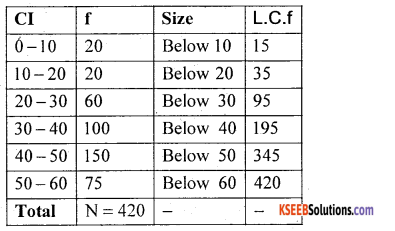
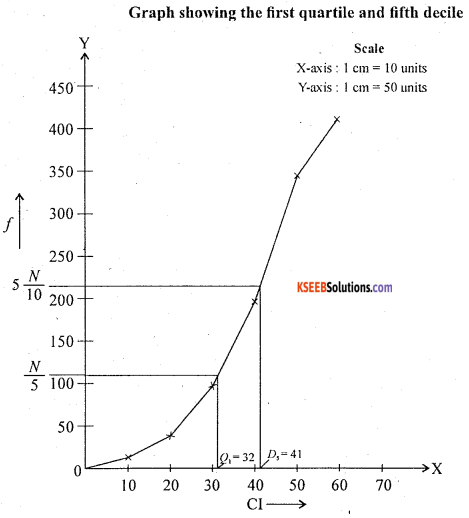
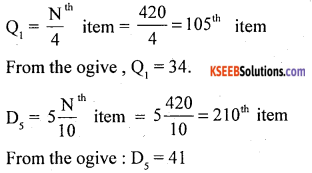
Question 42.
Draw a less than ogive and locate Q1 and D5 from the give.
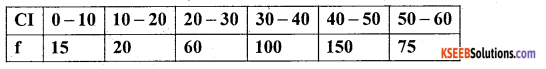
Answer:
Question 43.
Compute mean deviation from median for the following data.
Wages (₹) : 22 17 64 43 67 32 55
Answer:
Let x be the wages ….. Raw data.
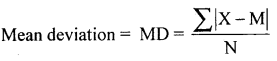
After arranging in ascending order
![]()
Question 44.
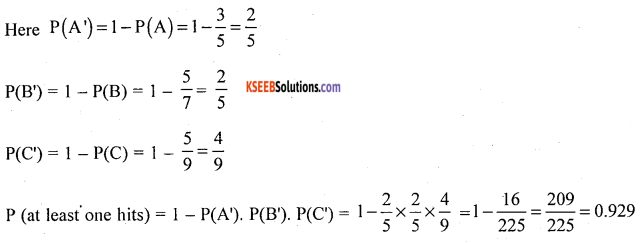
A can hit a target 3 times with 5 shots. B can hit it 5 times with 4 shots and C can hit 5 times with 9 shots. If they fire at a volley, what is the probability that at least one of them hits it?
Answer:
Let P(A can hit) = \(\frac { 3 }{ 5 }\) = P(A)
P(B) = \(\frac { 5 }{ 7 }\) and P(C) = \(\frac { 5 }{ 9 }\)
Assuming that all the 3 shooters are independent, then
P (at least one of them hits the volley)
P(A∪B∪C) = l – P(none hit) = l – P(A’∩B’∩C’)