Students can Download 1st PUC Economics Model Question Paper 2 with Answers, Karnataka 1st PUC Economics Model Question Papers with Answers helps you to revise the complete Karnataka State Board Syllabus and score more marks in your examinations.
Karnataka 1st PUC Economics Model Question Paper 2 with Answers
Time: 3.15 Hours
Max Marks: 100
Instructions:
- Write the question numbers legibly in the margin.
- Answer for a question should be continuous.
Section – A
I. Choose the correct answers: ( 1 × 5 = 5 )
Question 1.
Economics is the study of mankind in _______ of life.
(a) the ordinary business
(b) the weekly business
(c) special business
(d) chance
Answer:
(a) the ordinary business.
Question 2.
Which method of collection of data gives better results?
(a) Census
(b) Sample survey
(c) Innovation
(d) Distribution
Answer:
(b) Sample survey.
Question 3.
Railway Transport introduced in India in the year
(a) 1835
(b) 1776
(c) 1850
(d) 1853
Answer:
(c) 1850.
Question 4.
Economic reforms were introduced during
(a) 1948
(b) 1956
(c) 1988
(d) 1991
Answer:
(d) 1991
![]()
Question 5.
The act provides guaranteed wage employment to every poor household for minimum of 100 days in year is called
(a) PMRY
(b) SJSRY
(c) MGNERAGA
(d) SGSY
Answer:
(c) MGNERAGA.
II. Fill in the blanks: ( 1 × 5 = 5 )
Question 6.
In Tabular presentation data is presented in _______.
Answer:
Table.
Question 7.
Index numbers are expressed in _______.
Answer:
Percentage.
Question 8.
Taxes on incomes of individuals is called _______.
Answer:
Direct tax.
![]()
Question 9.
Investment on Education is considered as one of the main sources of _______.
Answer:
Human capital.
Question 10.
Forest is _______ resource.
Answer:
Natural.
III. Match the following: ( 1 × 5 = 5 )
Question 11.
| A | B |
| 1. Census | 1. Food production |
| 2. Arithmetic Mean | 2. Gross Domestic Product |
| 3. World Bank | 3. \(\bar{X}\) |
| 4. Green Revolution | 4. India and knowledge economy |
| 5. GDP | 5. Covers every individual |
Answers:
1-5
2-3
3-4
4-1
5-2
IV. Answer the following questions in a word sentence: ( 1 × 5 = 5 )
Question 12.
What is dispersion?
Answer:
Dispersion refers to the extent to which values in a distribution differ from the average of the distribution.
Question 13.
What is correlation?
Answer:
Correlation studies and measures the direction and intensity of relationship among variables
![]()
Question 14.
Give the meaning of poverty.
Answer:
Poverty is a state of living where people are unable to get the basic necessities of life.
Question 15.
Expand NCERT.
Answer:
National Council of Educational Research and Training.
Question 16.
What is rural development?
Answer:
Rural development means improvement of the socioeconomic lives of rural people by providing basic infrastructures which make them to engage in productive activities. In simple words, the term rural development refers to the overall development of the rural economy.
Section – B
V. Answer any four of the following questions in four sentences each: ( 2 × 4 = 8 )
Question 17.
Mention the two source of data.
Answer:
Primary data and secondary data are the two sources of data.
Question 18.
What is quantitative classification? Give an example.
Answer:
Quantitative classification is that classification where certain characteristics are measured quantitatively. Example, age, height, production, income, etc.
![]()
Question 19.
Write the merits of arithmetic mean.
Answer:
The following are the merits of arithmetic mean:
- It is simple to understand and easy to calculate.
- It gives certainty.
- It considers all observations in computing.
- It is a convenient method of comparison.
Question 20.
Mention types of Correlation.
Answer:
There are two types of correlation negative correlation and positive correlation. Again they are classified perfect positive and perfect negative correlations.
Question 21.
What is Price Index Number? Mention its types.
Answer:
Price index numbers measure the general changes in prices between the current year and the base year. The general price index is used to measure the value of money. The following are the different types of price index numbers:
- Consumer Price Index
- Wholesale Price Index
- Retail Price Index
- Producer Price Index.
![]()
Question 22.
Write the first four steps in developing a project.
Answer:
Following are the four steps in developing a project:
- Identifying a problem or an area of study,
- Choice of target group.
- Collection of data.
- Organisation and presentation of data.
VI. Answer any five of the following questions in four sentence each. ( 2 x 5 = 10 )
Question 23.
List out the important export goods of India before independence.
Answer:
The important export goods of India before independence were raw silk, cotton, wool, sugar, indigo, jute, etc.
Question 24.
Who are the urban poor? Give example.
Answer:
Urban poor are those who live in cities and towns without basic needs. Example: push cart, vendors, street cobblers, women who string flowers, rag pickers, vendors and beggars.
Question 25.
State the meaning of human capital.
Answer:
Human capital refers to that part of population which possesses skills, knowledge, education and experience. It also includes the ability of human beings to give their best and their ability to create economic value for things.
![]()
Question 26.
Name the institutional sources of rural credit.
Answer:
- Commercial Banks
- Regional Rural Banks (RRBs)
- Cooperative Societies
- Land Development Banks.
Question 27.
Who are self-employed ? Give two examples.
Answer:
The self-employed are those workers who own and operate an enterprise themselves to earn their livelihood. The best examples for self-employed are as follows:
- People running petty shops.
- People having their own transport enterprises.
- Farmers working in their own farm land.
- Engineers running their own construction companies.
- Teachers running their own tutorial or coaching centres.
- People having their own autos and cabs.
Question 28.
Which are the economic infrastructure?
Answer:
The economic infrastructural facilities are those which directly contribute towards economic development. The ma in economic infrastructures are energy, transportations communication, banking. insurance, warehouse, etc.
![]()
Question 29.
Mention any four functions of environment.
Answer:
Environment refers to the totality of the physical conditions on the earth or a part of it. In other words, it refers to physical surroundings. conditions, circumstances. etc., in which a person lives.
Environment is defined as the total planetary inheritance and the totality of all resources and includes biotic (birds, animals and plants, forests, fishes) and a biotic (air, water, land, rocks and sunlight) factors.
Thy major functions of environment are as follows:
- The environment supplies both renewable and non-renewable resources. Renewable resources are those resources that can he used again and again. There will be a continuous supply of resources. Example, water, forest, land etc.
- Non-renewable resources are those which get exhausted with extraction and use. Example. mineral resources like petrol. coal, iron ore etc.
- The environment assimilates waste. That means that environment absorbs the solid and liquid wastes created by humans and other living beings.
- The environment sustains the life on earth by providing both genetic and bio-diversities.
- Environment also provides aesthetic sceneries like beautiful scenery of forest lands, water falls, mountains like the Himalaya ranges. lagoons, glaciers, valleys. etc.
Section – C
VII. Answer any three of the following questions in twelve sentence each. ( 3 × 4 = 12 )
Question 30.
Briefly explain how statistics helps to study economics.
Answer:
Statistics plays a very important role in the field of economics. It helps in study of economics in many ways:
1. It helps to understand economic problems: By using various statistical tools, effort is being made to find the causes behind the economic problems with the help of qualitative and the quantitative facts. Once the causes of a problem are identified. it is easier to formulate certain policies to tackle them.
2. It enables an economist to present economic facts in a precise and definite form: Statistics help the economists to present economic facts with accuracy. It also helps in proper comprehension of that is stated in the subject matter. When economic facts are expressed in statistical terms. they become exact. Exact facts are more convincing than vague statements. For instance, saying 350 people have died in Kashmir unrest since 2000. is more accurate than saying that a lot of people have died in the unrest.
3. Helps in condensing mass data into a few numerical measures: Statistics condenses the mass data into a few numerical measures like mean, variance, correlation, etc. These numerical measures help to summarise data. For example, it would be impossible to remember the income of all the people of a country. But we can remember average income i.e., per capita income.
4. It is used to find relationships between different economic factors: An economist may be interested in finding out what happens to the demand for a commodity when its price changes or what will be impact on inflation, when the government has more budget deficits. Such situations can be dealt, if any relationship exists between the various economic factors. Here, the nature of relationship can be studied with the help of statistical tools.
5. It helps in formulation of plans and policies: Sometimes, formulating plans and policies require the knowledge of future trends. For instance, an economic planner has to decide in 2010 how much the economy should produce in 2016-17. In other words, one must know what could be the expected level of consumption in 2016-17. So. the statistical tools to predict consumption in 2016-17 could be based on the data of consumption of past years obtained by surveys.
![]()
Question 31.
Briefly explain sampling errors.
Answer:
Sampling error refers to the differences between the sample estimate and the actual value of a characteristic of the population. It is the error that occurs when you make an observation from the samples taken from the population.
Thus, the difference between the actual value of a parameter of the population and its estimate is the sampling error. It is possible to reduce the magnitude of sampling error by taking a larger sample.
For example, suppose the height of 5 students (in inches) are 50, 55, 60, 65, 70. Now, the average height will be calculated by adding all these observations and dividing the sum by 5 . then we get 60 inches. If we select a sample of two students with height of 50 and 60 inches, then average height of sample will be 50 + 60 divided by 2, we get 55 inches. Here the sampling error of the estimate will be 60 (true value) minus 55 (estimate) = 5.
Question 32.
Draw scatter diagram and conclude about correlation.
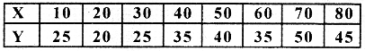
Answer:
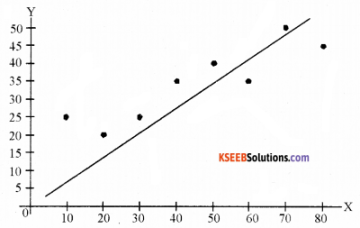
Conclusion: There is a positive correlation between the X and Y variable.
Question 33.
Write a note on classification of data.
Answer:
The raw data is classified in various ways depending on the purpose. Generally data can be classified as follows:
- Chronological classification: When the data is grouped according to time, it is called as chronological classification, in such a classification, data are classified either in ascending or in descending order with reference to time such as years, quarters, months weeks days, etc.
- Spatial classification: If the data are classified with reference to geographical locations such as countries, states, cities, districts, etc., it is called spatial classification.
- Qualitative classification: When the data are classified on the basis of certain attributes or qualities like literacy, religion, gender, marital status etc., then it is called qualitative classification. These attributes can be classified on the basis of either the presence or the absence of a qualitative characteristic.
- Quantitative classification: If the classification of data is done on the basis of certain characteristics like height, weight. age, income, marks of students etc., it is called as quantitative classification.
![]()
Question 34.
Mention the difficulties in construction of Consumer Price Index.
Answer:
The following are the difficulties encountered during the construction of consumer price index:
- Index numbers are not based on all items: As index numbers are generally based on a couple of sample, it is not possible to take into account each and every item in the construction of index.
- Index numbers are not free from error: In every stage of the construction of index numbers, starting from selection of commodities to the choice of formulae there is a chance an error being introduced.
- It is also said that, index numbers are also special type of averages, since the various averages like mean, median and mode and have their relative limitations which may lead to some errors.
- Index numbers are meant for a particular purpose: An index number is used to measure the change for a particular purpose only.
- Prices used in the construction of cost of living index are retail prices, which vary from shop to shop, place to place and consumer to consumer. Therefore, index numbers prepared on such prices cannot be used for different places or different classes of people.
- Index numbers include so many commodities of unstable quality, which can not be used at different points of time.
- The ratio of expenditure on different products at different points of time and by various persons are not same and they create difficulties in the construction of cost of living index numbers.
VIII. Answer any four of the following questions in twelve sentence each. ( 4 × 4 = 16 )
Question 35.
The traditional handicraft industries were ruined under British rule.
Answer:
Yes, the traditional handicrafts industries were ruined under the British rule. The decline of the indigenous handicraft industries created not only massive unemployment in India but also a new demand in the Indian consumer market, which was now deprived of the supply of locally made goods.
The British imposed heavy duties on Indian handicrafts, so that they became more expensive than British woolen and silk manufacturers. They followed a policy of duty free export of raw materials and import of finished goods. Apart from these, Indian handicrafts had to face competition from machine made goods from Britain.
India could not develop a sound industrial base under the colonial rule. Even as the country’s world famous handicraft industries declined, no corresponding modern industrial base was allowed to come up to take pride of place so long enjoyed by the Indians.
The intention of British was to reduce India to the status of a mere exporter of important raw materials for the upcoming modem industries in Britain and to turn India into a market for their finished products of those industries, so that their continued expansion could be ensured to the maximum advantage of their home country.
![]()
Question 36.
Give the meaning and importance of small scale industries.
Answer:
A small scale industry’ is defined with reference to the maximum investment allowed on the assets of a production unit. A small scale industry is one where the investment is less than one crore rupees.
Small scale industries play a very important role in the economic development of India. It is a known fact that small scale industries are more labour intensive i.e., they use more labour than the large scale industries and therefore, generate more employment.
Apart from the above, the small scale industries require less capital as they are small units. They are free from industrial unrest. They also depend on indigenous resources and need not depend on foreign resources. Small scale industries were also given concessions like lower excise duty and bank loans at lower interest rates.
Question 37.
Briefly explain the financial sector reforms.
Answer:
The financial sector consists of financial institutions like commercial banks, investment banks, stock exchange operations and foreign exchange market. The financial sector in India is regulated by the Reserve Bank of India. The RBI decides the amount of money that the banks can keep with themselves, fixes interest rates, nature of lending to various sectors, etc.
The major objective of financial sector reforms is to reduce the role of RBI from regulator to facilitator of financial sector. That means, the financial sector ma be allowed to take decisions on many matters independent of RBI.
The financial sector reform policies led to the establishment of private sector banks both Indian and foreign. Foreign investment limit in banks was raised to around 50%. The banks which fulfill certain conditions have been given freedom to set up new branches without the approval of the RBI. Foreign institutional investors (Fill) like merchant bankers, mutual funds and pension funds are now allowed lo invest in Indian financial markets.
Question 38.
Explain the drawbacks of agricultural marketing.
Answer:
Agricultural marketing is a process that involves the assembling, storage. processing. transportation, packaging, grading and distribution of different agricultural commodities across the country. The major drawbacks of agriculture marketing in India are as follows:
- Long chain of middlemen taking away the profit of farmers.
- No proper storage facilities to protect the agricultural products.
- Faulty methods of weighing/measuring agricultural crops.
- Manipulation of accounts.
- Farmers are forced to sell their products at low prices due to lack of information.
![]()
Question 39.
Briefly explain the importance of infrastructure in India.
Answer:
The infrastructure helps the modern economy as follows:
- It supports the system for efficient working of industrial sector.
- It encourages speedy development of agricultural sector.
The agriculture and other industries largely depend on infrastructure. Transportation of seeds, pesticides, fertilizers and the produce using modern roadways, railways and shipping facilities help in development of agriculture which leads to development of an economy:
- Infrastructure contributes to the economic development of a country both by increasing the productivity of the factors of production and improving the quality of life of its people.
- Improvements in water supply and sanitation have a large impact on reducing morbidity i.e., being prone to illness, from major waterborne diseases and reducing the severity of disease when it occurs.
- The transport and communication also influence the health care facilities.
Question 40.
What are the various indicators of Human Development?
Answer:
The various indicators of human development are as follows:
- Human development index: It consists of standard of living index, life expectancy at birth and educational attainment. If the HDI is high it is good indicator of human development.
- Life expectancy at birth: It is the average number of years a person is expected to live. In other words, it is the longevity of life. A high value of life expectancy better indicates a quality human development.
- Adult literate: It is the average number of persons who have reading and writing skills with basic local knowledge. It is expressed in percentages. The high literacy rate shows high human development.
- GDP per capita: The gross domestic product per head is also one of the indicators of human development. The high value of GDP per capita indicates a better human development.
- Infant mortality rate: It means the death of babies per thousand live births. If the IMR is high it indicates low human development.
- Maternal mortality rate: It shows the death of mothers per 1 lakh live births. If MMR is low, it indicates a better human development.
- Population using improved sanitation: If the percentage of population using improved sanitation is more, it is a good indicator of human development.
- Population with sustainable access to improved water sources: If the percentage of population using sustainable access to improved resource is high, it is a good indicator of human development.
- People living below poverty line: If less people are living below poverty line, then it is a good indicator of human development.
- Percentage of children undernourished: If the number of undernourished children is diminishing, then ¡t is a good indicator of human development.
Section – D
IX. Answer any two of the following questions in about twenty sentence each. ( 2 × 6 = 12 )
Question 41.
What is tabulation? What are the parts of table? Explain.
Answer:
When data is represented in rows and columns, it is called tabulation. To construct a table, it is important to know the different components of a good statistical table. When all the components are put together systematically, they form a table.
Tabulation can be done using one way, two way or three way classification depending upon the number of characteristics involved. A good table should have the following parts:
- Table number: Table number is given to a table for identification purpose. If more than one table is presented, it is the table number that distinguishes one table from another. It is given at the top or at the beginning of the title of the table.
- Title: The title of the table gives about the contents of the table. It has to be very clear, brief and carefully worded, so information interpretations made from the table are clear and free from any confusion.
- Captions: These are the column headings given as designations to explain the figures of the column.
- Stubs: These are headings given to rows of the table. The designations of the rows are also called stubs or stub items and the left column is known as stub column.
- Body of the table: It is the main part and it contains the actual data. Location of any one data in the table is fixed and determined by the row and column of the table.
- Head note/Unit of measurement: The units of measurement of the figures in the table should always be stated along with the title. If figures are large, they should be rounded off and the method of rounding should be indicated.
- Source: It is a brief statement or phrase indicating the source of data presented in the table. If more than one source is there, all the sources are to be mentioned.
- Note: It is the last part of the table, It explains the specific feature of the data content of the table which is not self explanatory and has not been explained earlier.
![]()
Question 42.
Calculate mode from the following distribution :
| Daily wages | No. of workers |
| 10 – 20 | 7 |
| 20 – 30 | 11 |
| 30 – 40 | 18 |
| 40 – 50 | 12 |
| 50 – 60 | 9 |
| 60 – 70 | 6 |
Answer:
| Daily wages ( x) | No of workers (f) |
|
10 – 20 |
7 11 |
| 30 – 40 | 18 |
| 40 – 50 50 – 60 60 – 70 |
12 |
By seeing the frequency column, we can make out that the class interval 30-40 is considered as the modal group. To find out exact mode the following formula is used.
M0 = L + \(\frac{\mathrm{D}_{1}}{\mathrm{D}_{1}+\mathrm{D}_{2}}\) × h
M0 = 30 + \(\frac{7}{7+6}\) × h
M0= 30 + \(\frac{7}{13}\) × 10
M0 = 30 + \(\frac{70}{13}\)
M0= 30 + 5.38
M0 = 35.38
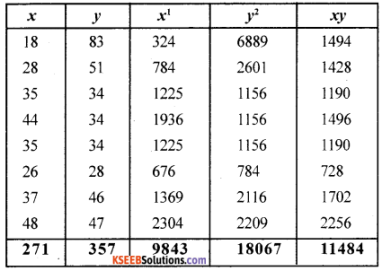
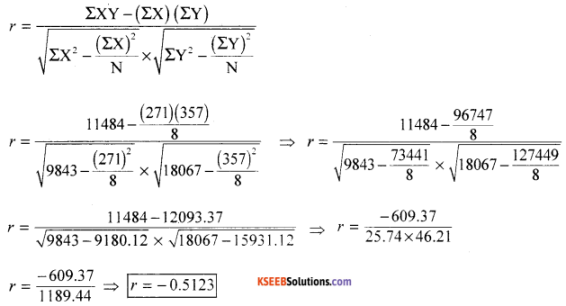
Question 43.
Calculate the correlation coefficient from following data:
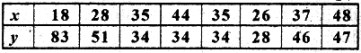
Answer:
Calculate correlation coefficient from following data:
X. Answer any two of the following questions in about twenty sentence each. ( 2 × 6 = 12 )
Question 44.
Explain the important areas of liberalization.
Answer:
Liberalization was one of the reforms of New Economic Policy of 1991. It was introduced to put an end to the restrictions and open up various sectors of the economy. The following are the important areas of liberalization:
1. Deregulation of industrial sector: The liberalization policy removed many restrictions enforced on industrial sector. Industrial licensing was abolished for almost all but product categories like alcohol, cigarettes, hazardous chemicals, industrial explosives, electronics, aerospace and drugs and pharmaceuticals.
The only industries which are not reserved for the public sector are defence equipments, atomic energy generation and railway transport. Many goods produced by the small scale industries have now been de-reserved.
2. Financial sector reforms: The financial sector consists of financial institutions like commercial banks, investment banks, stock exchange operations and foreign exchange market.
The financial sector in India is regulated by the Reserve Bank of India. The RBI decides the amount of money that the banks can keep with themselves, fixes interest rates, nature of lending to various sectors, etc.
The major objective of financial sector reforms is to reduce the role of RBI from regulator to facilitator of financial sector. That means, the financial sector may be allowed to take decisions on many matters independent of RBI.
The financial sector reform policies led to the establishment of private sector banks both Indian and foreign. Foreign investment limit in banks was raised to around 50%. The banks which fulfill certain conditions have been given freedom to set up new branches without the approval of the RBI. Foreign Institutional Investors (FIT) like merchant bankers, mutual funds and pension funds are now allowed to invest in Indian financial markets.
3. Tax reforms: These are the reforms which are concerned with government’s taxation and public expenditure policies which are collectively known as its fiscal policy. There are two types of taxes, direct and indirect.
Since 1991, there has been a continuous reduction in the taxes on individual incomes as it was felt that high rates of income tax were an important reason for tax evasion. It is now widely accepted that moderate rates of income tax encourage savings and voluntary disclosure of income.
The rate of corporation tax (tax on income of companies) which was very high earlier has been gradually reduced. A new tax called Goods and Services Tax (GST) has been introduced from 1.7.2017 to bring uniformity in indirect taxes.
In order to encourage better compliance on the part of tax payers, many procedures have been simplified and the rates also substantially lowered.
4. Foreign exchange reforms: During 1991, the Government took an immediate measure to resolve the balance of payments crisis, the rupee was devalued against foreign currencies. This led to an increase in the inflow of foreign exchange. It also set the tone to free the determination of rupee value in the foreign exchange market from government control. At present, the market forces i.e., demand and supply, determine the exchange rates.
5. Trade and investment policy reforms: A new trade and investment policy under liberalization strategy was made to increase international competitiveness of industrial production and a foreign investments and technology into the economy. The aim was also to promote the efficiency of the local industries and the adoption of modem technologies.
To protect Indian industries, the government was following quantitative restrictions on imports which encouraged tight control over imports. At the same time, tariffs were very high. These policies reduced efficiency and competitiveness which led to a slower growth of manufacturing sector.
The main objectives of Trade and Investment Policy were:
- To remove quantitative restrictions on imports.
- To reduce quantitative restrictions in exports.
- Reducing tariff rates.
- Removal of licensing system.
Import licensing was abolished except in case of hazardous and environmentally sensitive industries. Quantitative restrictions on imports of manufactured consumer goods and agricultural products were also fully removed. Export duties have been removed to increase the competitive position of Indian goods in the international markets. A process of disinvestment was also initiated by selling of part of equity shares of public sector enterprises to the public.
![]()
Question 45.
Discuss the following as a source of Human Capital Formation.
(1) Expenditure of Education
(2) Expenditure on Health.
Answer:
1. Health infrastructure: The various forms of health expenditures are as follows:
- Preventive medicine vaccinations to prevent deadly diseases.
- Curative medicine obtaining medical treatment during illness.
- Social medicine spread of awareness about keeping good health and its importance.
- Provision of clean drinking water and good sanitation.
The healthy individuals are a food source of human capital as they directly contribute for regular and higher productivity of labour. A sick labourer without access to medical facilities has to remain absent from work. This leads to loss of productivity. Hence, expenditure on health is an important source of human capital formation.
2. Expenditure on migration: People migrate from their native places in search of jobs which may bring higher salaries. Unemployment is the only reason for rural-urban migration in India. Technically qualified persons like engineers and doctors migrate to other countries to earn better income.
Though there is a high cost of transport, high cost of living and other factors, the enhanced income will motivate people to migrate. Hence, expenditure on migration is also a source of human capital formation.
Question 46.
What are the main causes of unemployment In India?
Answer:
The main causes for unemployment in India are as follows:
1. Population explosion: Rapid population growth is the leading factor responsible for unemployment in India. This has adversely affected the unemployment situation in two ways. Firstly, the growth of population has directly encouraged unemployment by making a large addition to the existing labour force. Secondly, the rate of job expansion could never be as high as the population growth would have required.
2. Season agricultural and backwardness of agricultural: In rural economy, agriculture is the main source of employment. However, most of the rural people are engaged directly and indirectly in agricultural operations. But, agriculture in India is basically a seasonal occupation. It provides employment only for certain months i.e., only during rainy days. During the rest of the period in a year, people would become unemployed.
3. Illiteracy and ignorance: Many people are illiterates and unskilled. They are not trained in accordance with the employment being generated. There is miss-match between the education industry and employment industry.
4. Slow growth: The growth of Indian economy is not at the expected level. The growth of GDP is still less than 7%. That means income which is being contributed to the national income generated through creation of employment opportunities is insufficient.
5. Lack of initiatives from government: In India, the government is inactive in creation of jobs. Rather, the government is indulging in disinvestment and closing Public Sector Industries due to industrial sickness. This is aggravating the problem of unemployment.
6. Low investment: There is a decline in the rate of investment due to lack of supportive atmosphere both in private and public sectors. This has slowed down the creation of new employment opportunities in India.
7. Orthodox nature of population: In India, majority of people are traditional and very orthodox and believe in blind beliefs. Many will be sticking on to some age old occupation even many though it has lost scope in the modem word. This has made them voluntarily unemployed.
XI. Answer any two of the following project oriented questions. ( 2 × 5 = 10 )
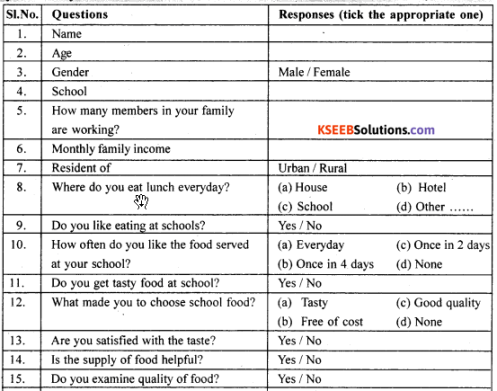
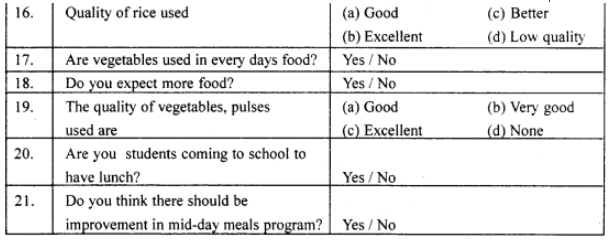
Question 47.
Suppose you are a research student and you are asked to conduct a sample survey about the midday meals program in schools prepare a good questionnaire to support your survey.
Answer:
![]()
Question 48.
Suppose you are a resident of a village. Suggest a few measures to tackle the problem of poverty.
Answer:
If we support ¡n implementing the following programmes successfully we can easily eradicate the poverty:
- Swarnajayanti Gram Swarozgar Yojana (SGSY)
- Swamajayanthi Shahari Rozgar Yojana (SJSRY)
- Pradhana Manthri Rozgar Yojana (PMRY)
- National Food for Work Programme (NFWP)
Question 49.
Identify the formal and informal sectors given in the list.
(a) Agricultural labourers
(b) Street vendor
(c) Petty shop owner
(d) Bank employee
(e) Teacher
(f) Saloon shop owner.
Answer:
(a) Agricultural labourers – informal worker
(b) Street vendor – informal worker
(c) Petty shop owner – informal worker
(d) Bank employee – formal worker
(e) Teacher – formal worker
(f) Saloon shop owner – informal workers